 Permanecer
Condiciones de negociación
Products
Herramientas


The US initial unemployment claims grew more than expected last week. This is a negative factor for the US labor market.
Basic readings in the weekly update by the US Labor Department
Continuing unemployment claims rose from 1.680 million to 1.696 million
Initial unemployment claims dipped marginally by 1K to 194K from 195K
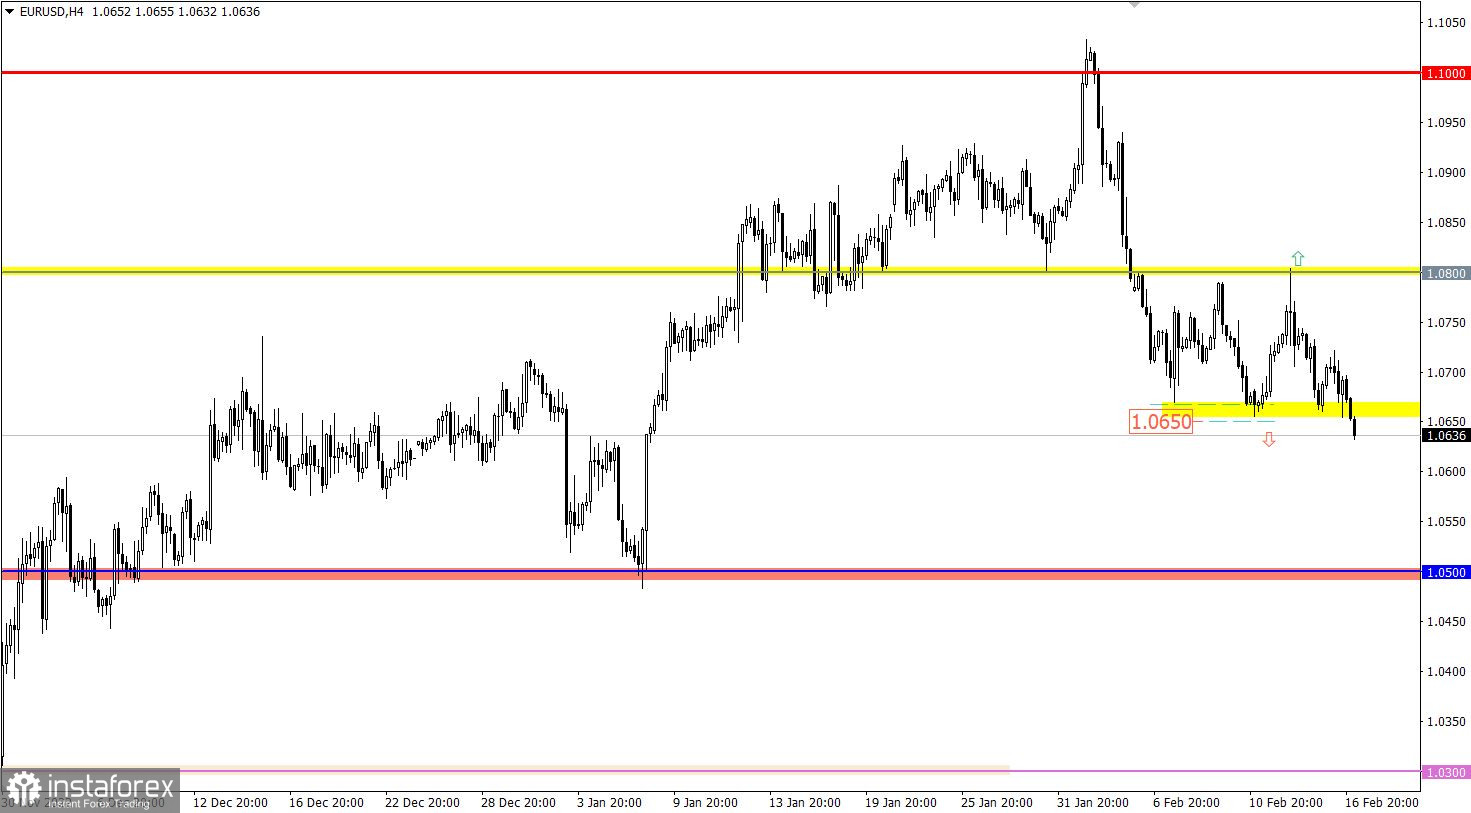
The euro is under selling pressure against the US dollar. Indeed, EUR/USD has been settled at about 1.0650. Importantly, the currency pair has been trapped sideways for 8 trading days in a row within the borders between 1.0650 and 1.0800.
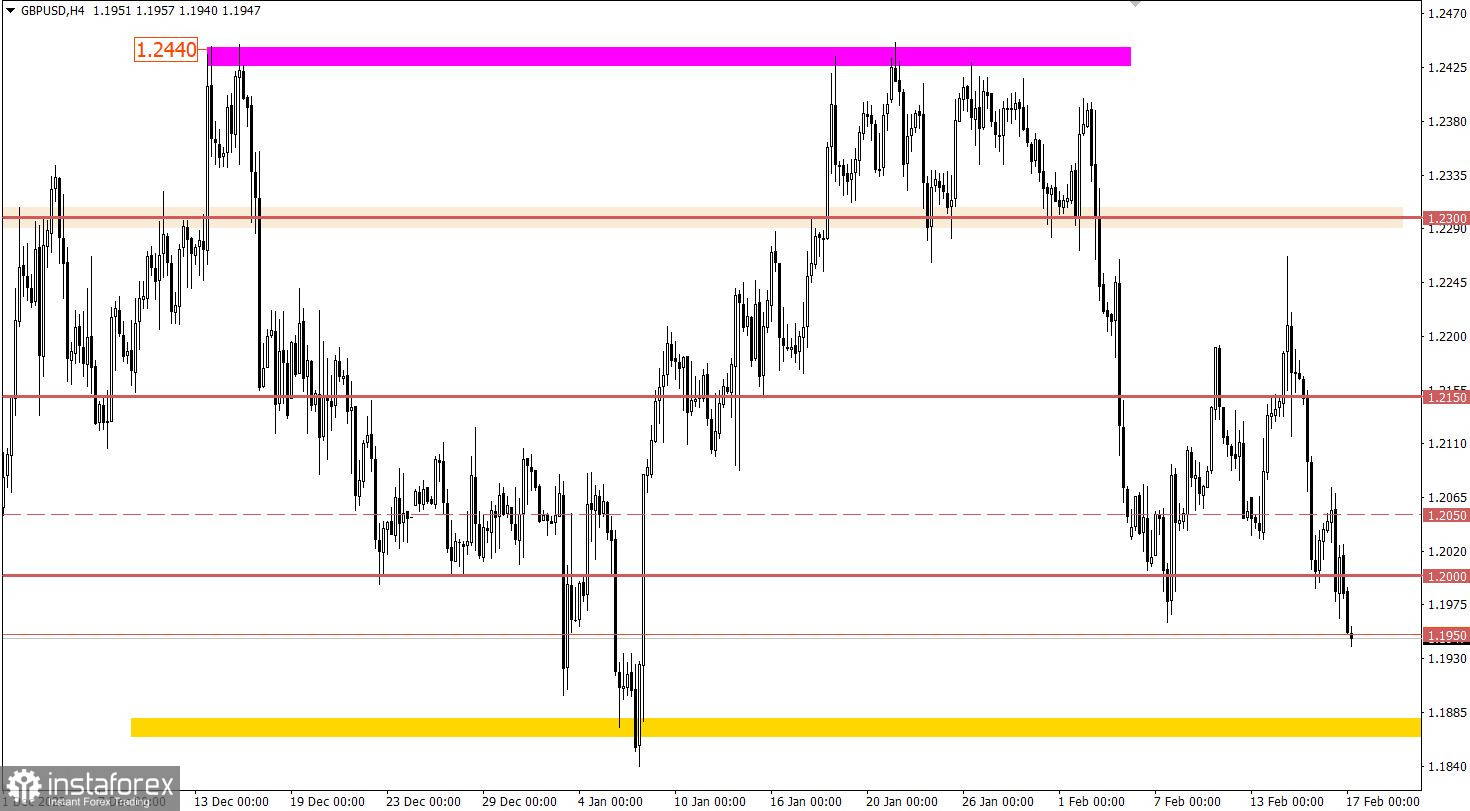
GBP/USD has been following a clear-cut downward trajectory, if we look at the price move from February 14 to 17. As a result of this price action, the pound sterling weakened by almost 250 pips. The interesting development was that the psychological level of 1.2000 was targeted by the sellers. The odds are that the level will be broken.
During the early European session today, market participants found out that the UK retail sales slowdown down their decline from -6.1% to -5.8% in January. Notably, the previous reading was downgraded from -5.8% to -6.1%
The pound sterling extended its weakness in response.
If EUR/USD settles firmly below 1.0650 in the 4-hour timeframe, traders will increase short positions. This will prolong the correctional move of the instrument.
According to the alternative scenario, it will come into play in case the price rebounds off 1.0650. In this case, the currency pair will get stuck in a range-bound market.
If the price settled below 1.0950 in the 4-hour timeframe, the instrument will break the level of 1.2000 shortly after. This price action will generate a sell signal for the pound sterling. The next technical signal will emerge after the price settles below 1.9000 in the daily timeframe. This move will indicate that the price will leave a wide range between 1.2000 and 1.2500 and develop a downward bias.
Nevertheless, be aware there is still a probability that the price could bounce off 1.9000/1.0950, bearing in mind price fluctuations in early January. In this case, the instrument is likely to develop a new leg higher.
The candlestick chart type is white and black graphic rectangles with lines above and below. With a detailed analysis of each individual candle, you can see its characteristics relative to a particular time frame: opening price, closing price, intraday high and low.
Horizontal levels are price coordinates, relative to which a price may stop or reverse its trajectory. In technical analysis, these levels are called support and resistance.
Circles and rectangles are highlighted examples where the price reversed in history. This color highlighting indicates horizontal lines that may put pressure on the asset's price in the future.
The up/down arrows are landmarks of the possible price direction in the future.
¡Los informes analíticos de InstaForex lo mantendrá bien informado de las tendencias del mercado! Al ser un cliente de InstaForex, se le proporciona una gran cantidad de servicios gratuitos para una operación eficiente.


