 Permanecer
Condiciones de negociación
Products
Herramientas

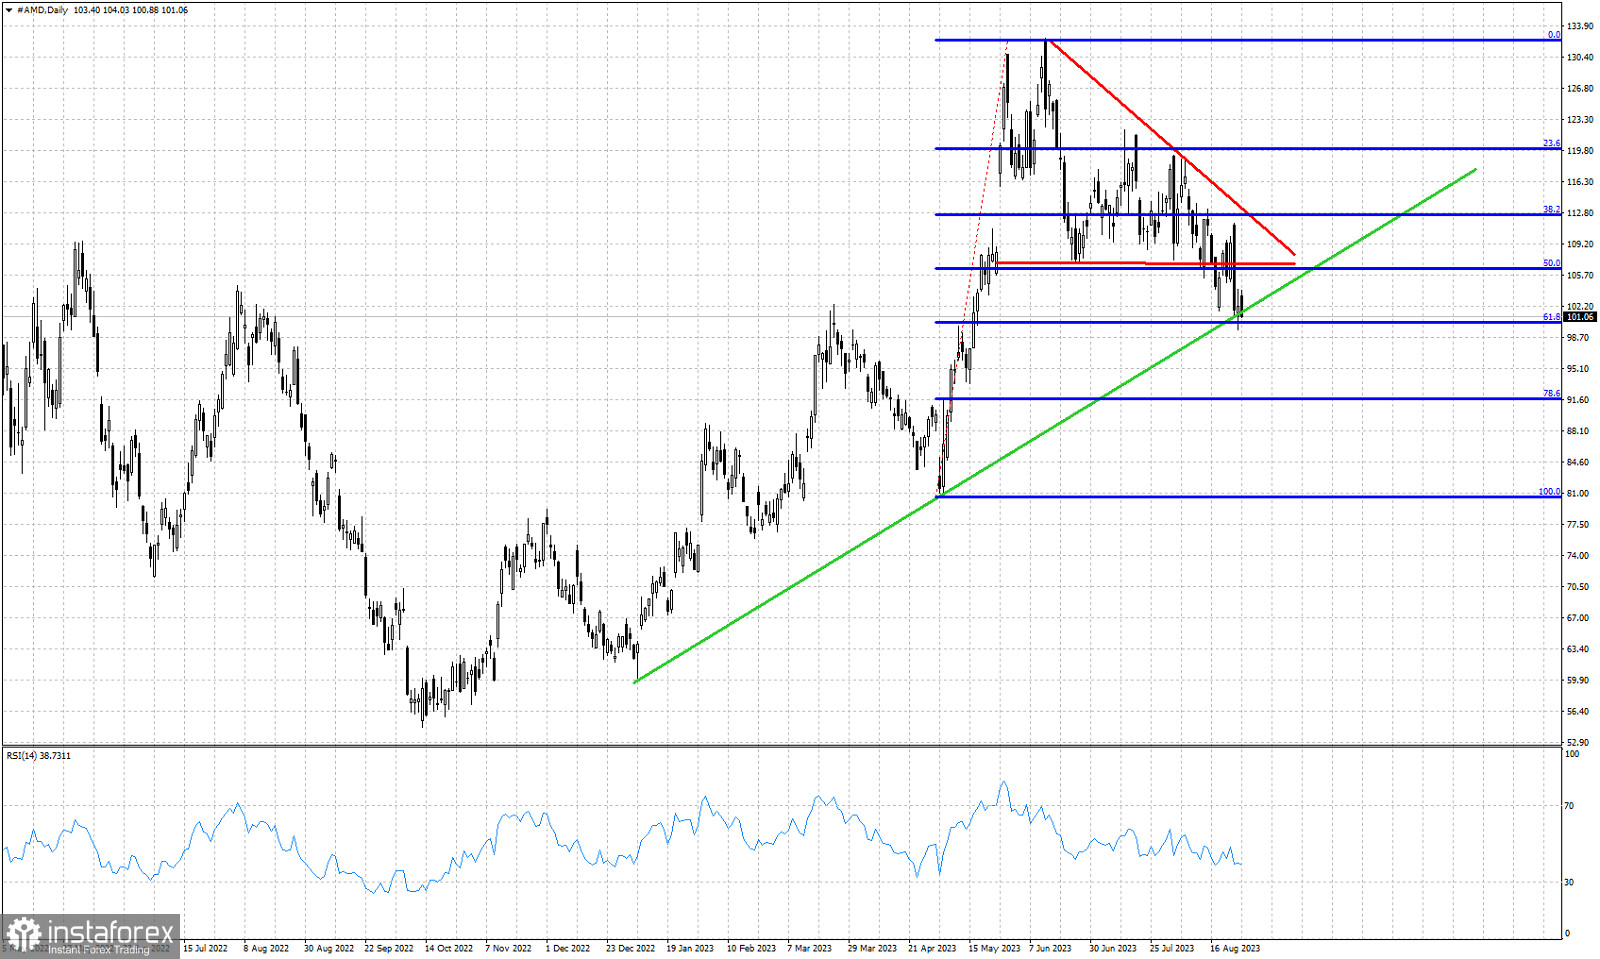
Green line- support trend line
Blue lines- Fibonacci retracement levels
Red lines- triangle pattern
AMD stock price is trading around $102. Short-term trend is bearish. Price has broken the triangle pattern to the downside. Price is making lower lows and lower highs in the near term. Price has reached the 61.8% Fibonacci retracement of the last major upward move. Price is also challenging the green upward sloping support trend line. Around $102 we find important short-term support. Breaking below $102 and staying below this level will lead price towards at least $92-$91 where we find the 78.6% Fibonacci retracement. Previous support at $107 is now resistance. Bulls need first to recapture this level in order to hope for a bigger move higher.
¡Los informes analíticos de InstaForex lo mantendrá bien informado de las tendencias del mercado! Al ser un cliente de InstaForex, se le proporciona una gran cantidad de servicios gratuitos para una operación eficiente.


