 Permanecer
Condiciones de negociación
Products
Herramientas


The economic calendar is traditionally empty on Monday. No important reports were expected in the Eropean Union, the United Kingdom, and the Unites States.
In this regard, investors and traders focused on the current information and news flow. Current topics: inflation, interest rates, and problems in the banking sector. It is worth noting that ECB President Christine Lagarde gave a speech twice and assured investors that there are no problems in the European banking sector.
The main theses of ECB President Christine Lagarde's speech:
- The ECB closely monitors market developments.
- We are ready to act as needed regarding price and financial stability.
- Eurozone banking sector is strong.
- Vulnerabilities in the non-bank financial sector could exacerbate volatility and asset price corrections.
- Eurozone banks' exposure to Credit Suisse was in euro millions, not billions.
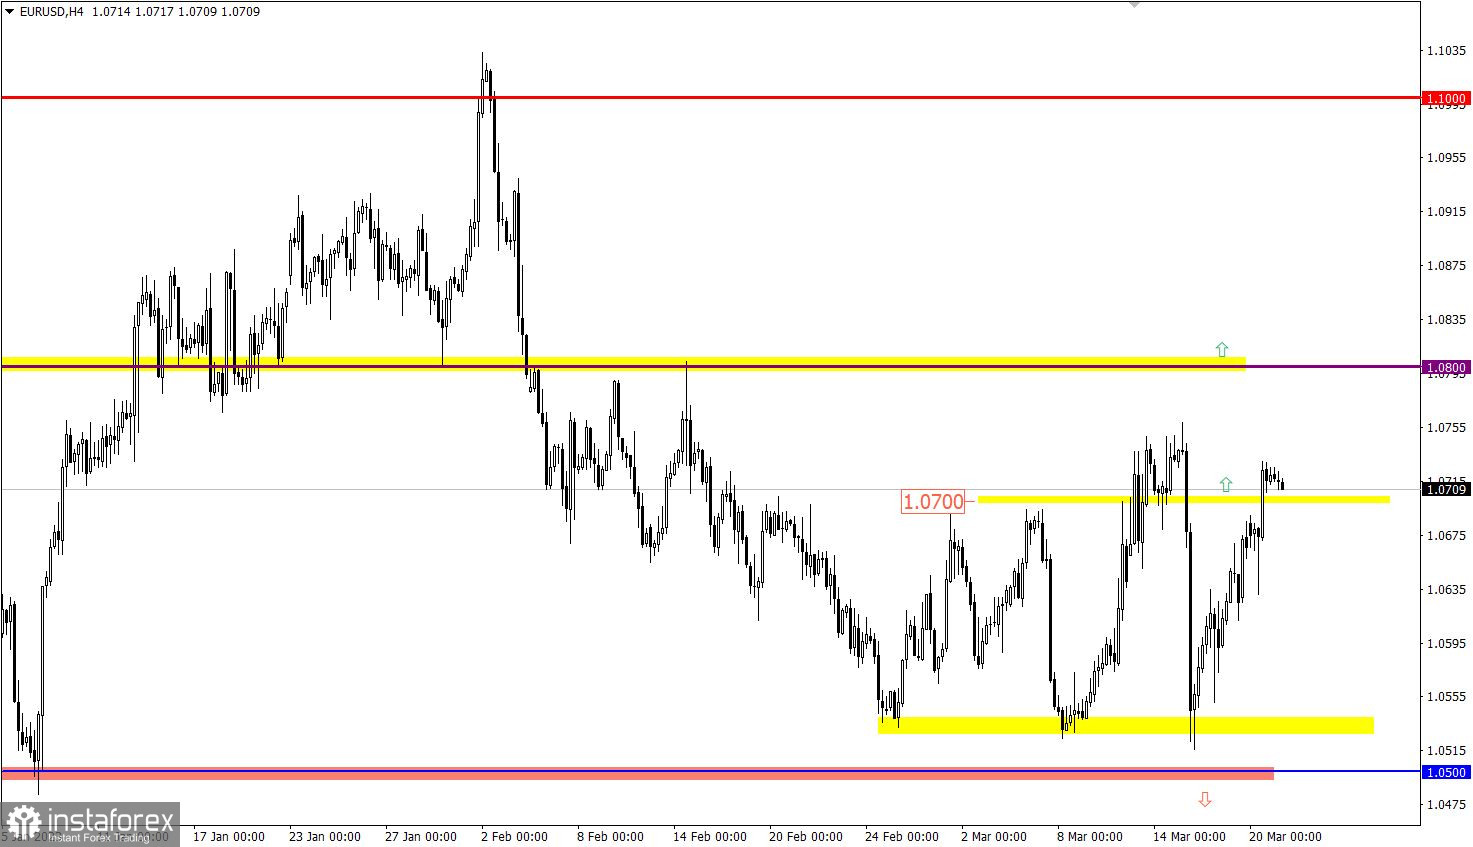
EUR/USD continued to rise and has already crossed the 1.0700 mark, which shows that the price has fully recovered from its recent fall, and buyers are willing to keep rising.
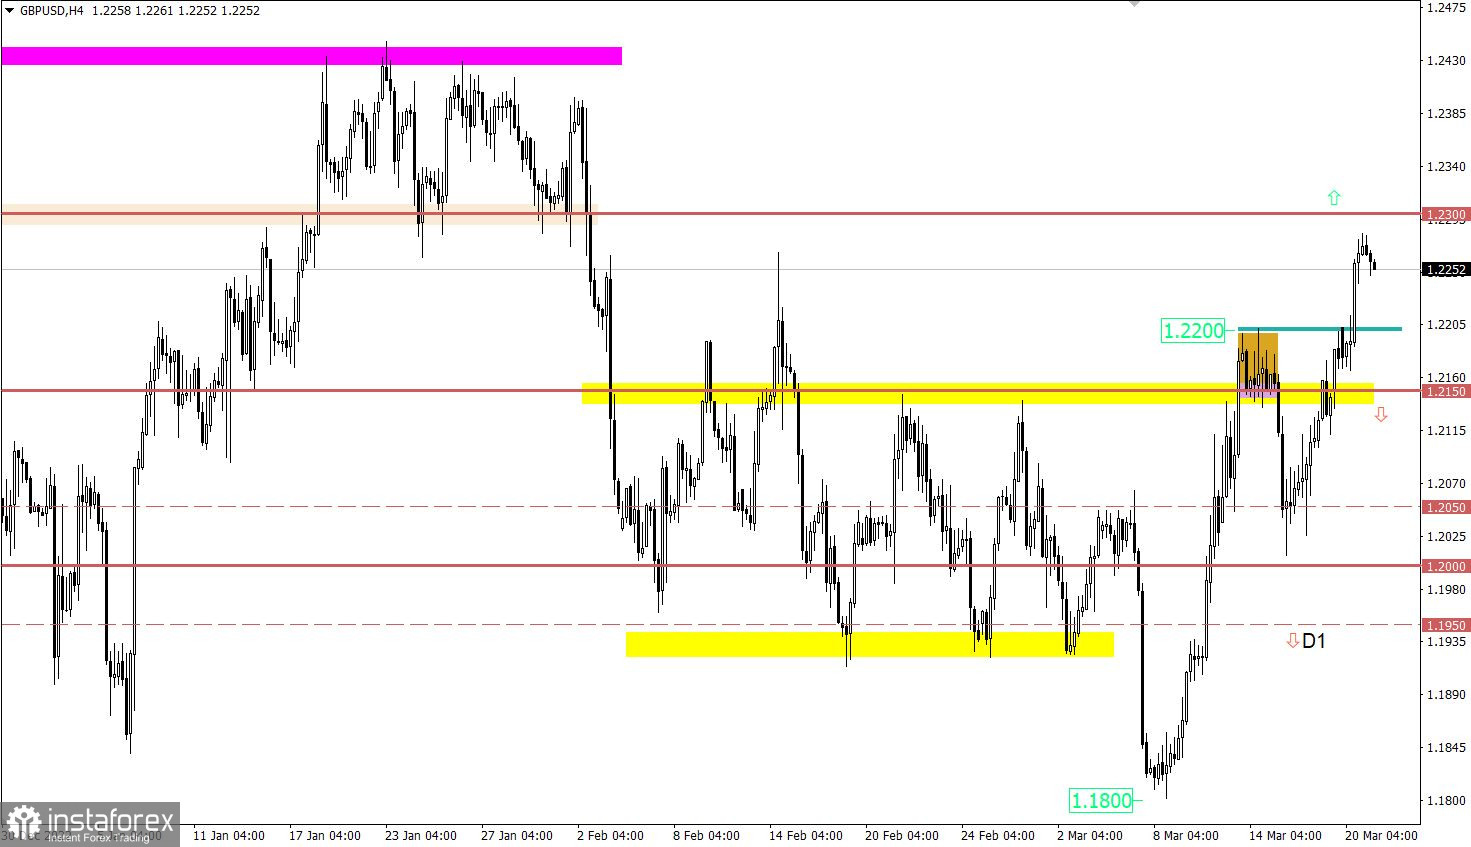
GBP/USD updated the local high of the previous week. This move led to the price holding above 1.2200, which, in turn, provoked an increase in the volume of long positions.
Existing home sales in the United States are expected to be released today. Economists predict an increase in indicators for February.
Time targeting:
Existing Home Sales (MoM) for February: Forecast +5%
In this situation, if the price holds above the 1.0700 level, it may lead to an increase in the volume of long positions. However, to confirm the continuation of growth, it is necessary to wait for the update of the local high of the previous week. In this case, a step-by-step recovery process after the downward cycle in February is possible.
Traders will also consider the downward scenario. The quote has been moving in the lateral amplitude of 1.0550/1.0700 for a month and only has a deviation for a while. Thus, it is impossible to exclude the subsequent movement within the framework of the current flat.
At the moment, the quote is approaching the level of 1.2300, which is a significant resistance level, possibly limiting the further price growth and leading to the reduction of the volume of long positions. In this case, the formation of a pullback or stagnation is possible. However, holding the price above this level, at least for a four-hour period, could lead to further growth in the direction of the local high of the medium-term upward trend.
The candlestick chart type is white and black graphic rectangles with lines above and below. With a detailed analysis of each individual candle, you can see its characteristics relative to a particular time frame: opening price, closing price, intraday high and low.
Horizontal levels are price coordinates, relative to which a price may stop or reverse its trajectory. In the market, these levels are called support and resistance.
Circles and rectangles are highlighted examples where the price reversed in history. This color highlighting indicates horizontal lines that may put pressure on the asset's price in the future.
The up/down arrows are landmarks of the possible price direction in the future.
¡Los informes analíticos de InstaForex lo mantendrá bien informado de las tendencias del mercado! Al ser un cliente de InstaForex, se le proporciona una gran cantidad de servicios gratuitos para una operación eficiente.


