 Permanecer
Condiciones de negociación
Products
Herramientas


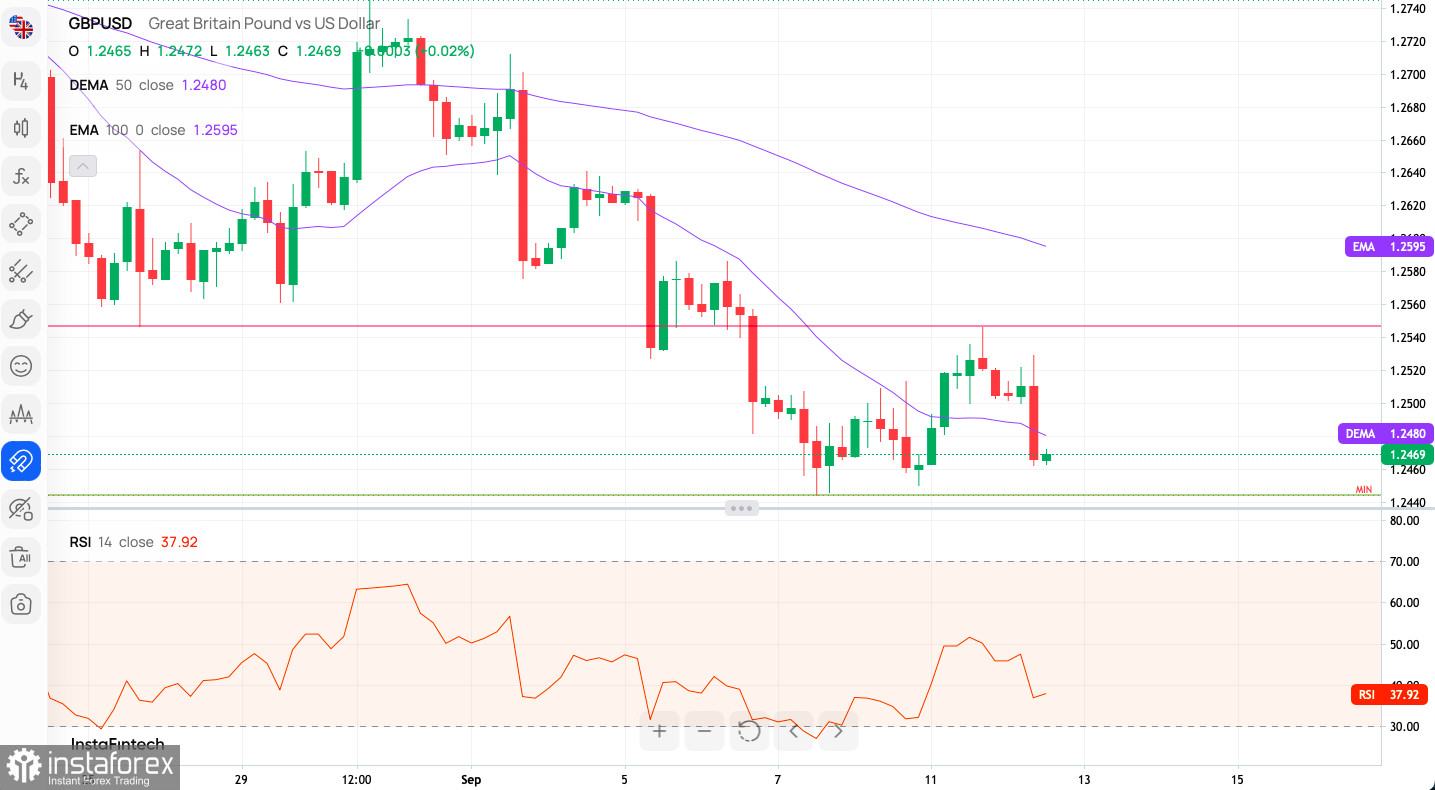
Technical Market Outlook:
The GBP/USD pair has been moving lower on the H4 time frame chart after the bulls got rejected from the level of 1.2546 during the bounce attempt. The market still trades below the short-term trend line resistance, so any violation of the short-term support seen at the level of 1.2444 will extend the drop lower towards the level of 1.2393 and 1.2377. The intraday technical resistance is seen at the level of 1.2546 and the intraday technical support is seen at the level of 1.2450. The weak and negative momentum on the H4 time frame chart support the short-term bearish outlook for GBP, however, now is the time for bull to bounce higher and test the technical resistance.
Weekly Pivot Points:
WR3 - 1.26098
WR2 - 1.25569
WR1 - 1.25339
Weekly Pivot - 1.25040
WS1 - 1.24810
WS2 - 1.24511
WS3 - 1.23982
Trading Outlook:
The bulls were rejected at the key technical resistance located at the level of 1.3163 and a breakout above this level is needed to extend the up trend towards the last Weekly swing high seen at 1.4248. The weekly time frame chart shows the Bearish Engulfing candlestick pattern was made during the breakout attempt above the 1.3163, so now the bears are in charge of the market. Any sustained breakout below the technical support seen at the level of 1.1775 would dramatically increase the chances of another leg down towards the level of 1.1494.
¡Los informes analíticos de InstaForex lo mantendrá bien informado de las tendencias del mercado! Al ser un cliente de InstaForex, se le proporciona una gran cantidad de servicios gratuitos para una operación eficiente.


