 Permanecer
Condiciones de negociación
Products
Herramientas


Overview :
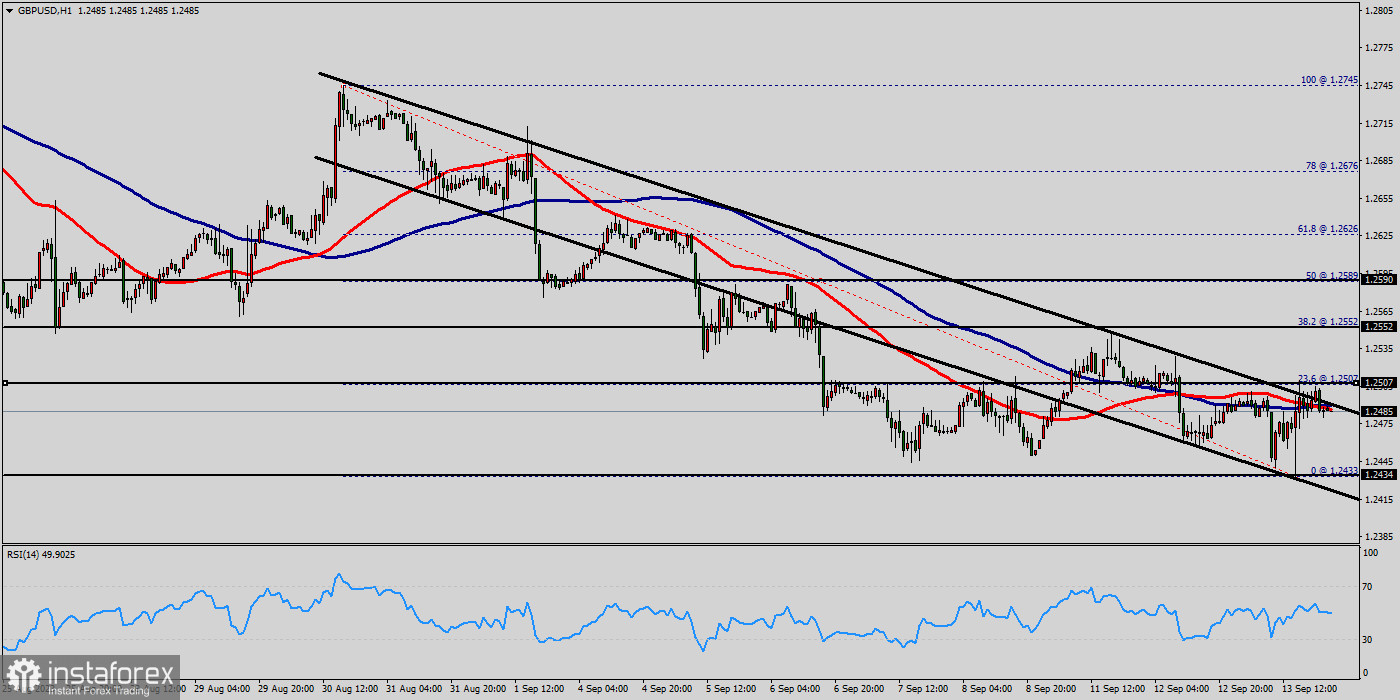
The GBP/USD pair will continue rising from the level of 1.2377 today. So, the support is found at the level of 1.2377, which represents the 23.6% Fibonacci retracement level in the H1 time frame. Since the trend is above the 23.6% Fibonacci level, the market is still in an uptrend. Therefore, the GBP/USD pair is continuing with a bullish trend from the new support of 1.2377.
The current price is set at the level of 1.2423 that acts as a daily pivot point seen at 1.2434. Equally important, the price is in a bullish channel. According to the previous events, we expect the GBP/USD pair to move between 1.2495 and 1.2377.
This would suggest a bullish market because the RSI indicator is still in a positive area and does not show any trend-reversal signs. Therefore, strong support will be formed at the level of 1.2377 providing a clear signal to buy with the target seen at 1.2460.
If the trend breaks the resistance at 1.2460 (first resistance), the pair will move upwards continuing the development of the bullish trend to the level 1.2495 in order to test the daily resistance 2. In the same time frame, resistance is seen at the levels of 1.2495 and 1.2500.
The stop loss should always be taken into account for that it will be reasonable to set your stop loss at the level of 1.2326 (below the support 2).
Remember:
- Sell: If the last range was medium, your profit will probably reach S1, double bottom and S2.
- Buy: If the last range was medium, your profit will probably reach R1, double top and R2. So, we expect new range will be around 200 - 399 pips next week.
Because the the previous range was less than 200 pips. Thus, probably, the trend will hit the weekly pivot point, support 1 and/or support 2, or resistance 1 and/or resistance 2. Because the support 3 and resistance 3 are located far than open price today.
¡Los informes analíticos de InstaForex lo mantendrá bien informado de las tendencias del mercado! Al ser un cliente de InstaForex, se le proporciona una gran cantidad de servicios gratuitos para una operación eficiente.


