 Permanecer
Condiciones de negociación
Products
Herramientas


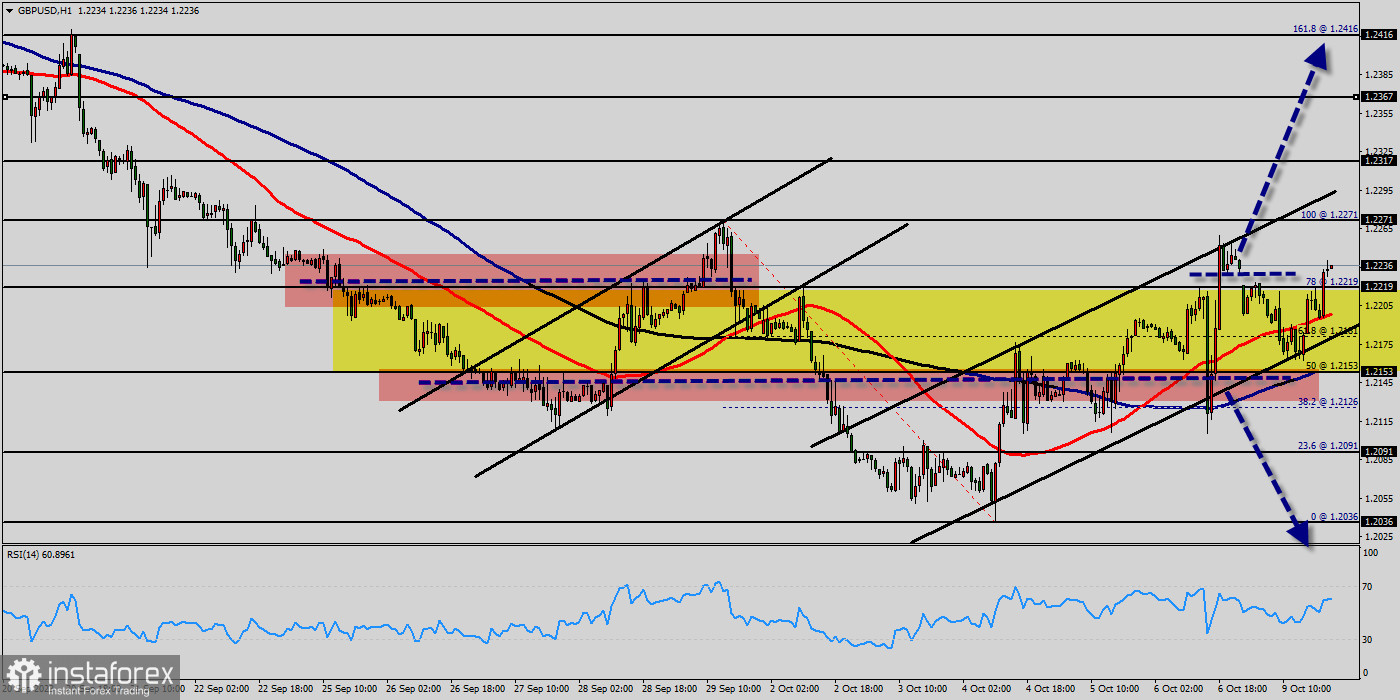
The current short-term bearish trend is expected to quickly reset the neutral or bearish trend. To avoid contradicting the short term, it would be possible to favour short positions (for sale) for the GBP/USD pair as long as the price remains well below the level of 1.2271. The next bearish objective for sellers is set at 1.2220.
However, during the Asian session, the US Dollar experienced a broad-based weakening as market sentiment improved. the GBP/USD pairmanaged to break above 1.2153 and continued its ascent towards 1.2240.
A bearish break of this support would revive the bearish momentum. The sellers could then target the support located at 1.2135.
In case of crossing, the next objective would be the support located at 1.2091. As the basic trend is not clearly displayed, attention should be paid to the price response to the support located at 1.2036.
With this support, against the trend traders who want to buy the GBP/USD pair on a buy signal from their trading strategy should not hesitate to act.
The Relative Strength Index (RSI) indicator on the one-hour chart managed to hold above 50 despite the latest decline. On the upside, 1.2181 (psychological level, Fibonacci 61.8% retracement of the latest downtrend) aligns as key resistance.
In case the pair stays below that level, 1.2271 (10-period Simple Moving Average) could be tested ahead of 1.2120 (upper limit of the broken descending regression channel) and 1.2091 (psychological level, static level -the last bearish wave).
¡Los informes analíticos de InstaForex lo mantendrá bien informado de las tendencias del mercado! Al ser un cliente de InstaForex, se le proporciona una gran cantidad de servicios gratuitos para una operación eficiente.

