 Permanecer
Condiciones de negociación
Products
Herramientas


Despite the significant correction observed on Thursday and Friday, the overall dynamics of DXY continue to remain downward. To enter the medium-term bull market zone and return to a long-term upward trend, the price needs to break through to the zone above key resistance levels of 103.45 (50 EMA on the weekly chart), 103.70 (200 EMA, 144 EMA on the daily chart).
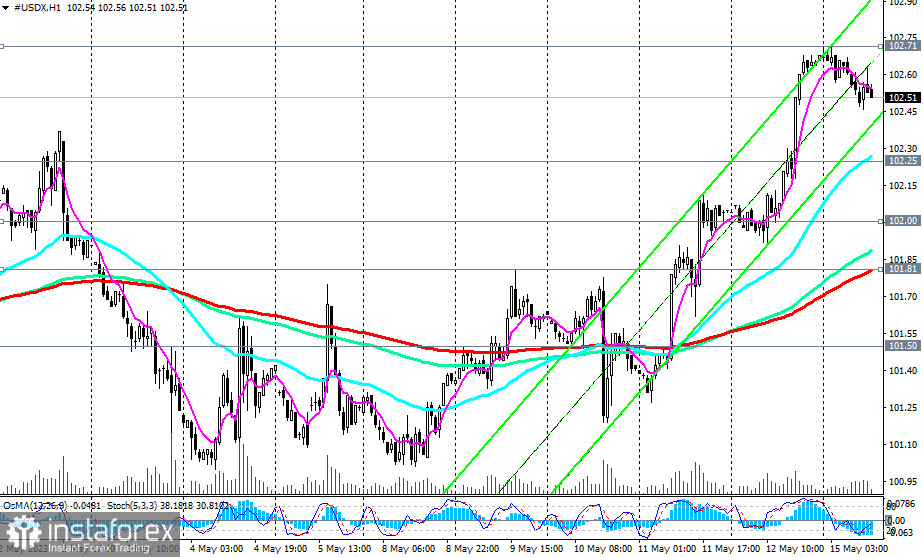
A signal here for opening long positions in the DXY index (CFD #USDX in the MT4 terminal) could be a break of the local resistance level at 102.71.
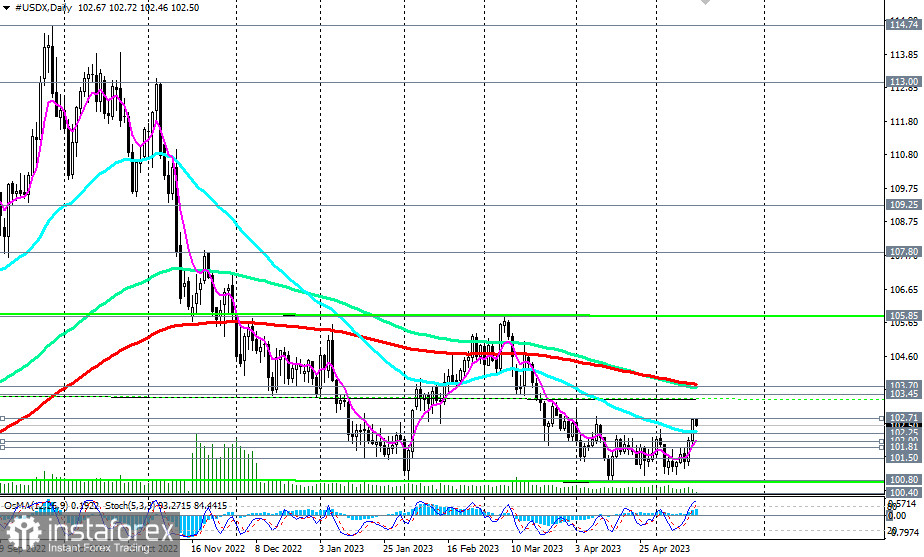
In the main scenario, the first signal to open short positions will be a breakdown of the important support level at 102.25 (50 EMA on the daily chart), and the confirming one will be a breakdown of short-term support levels at 102.00 (200 EMA on the 4-hour chart) and 101.81 (200 EMA on the 1-hour chart).
The nearest target for the decline is the local support level at 101.50. Its breakdown will open the way towards key support levels 100.40 (144 EMA on the weekly chart), 100.00, and 99.25 (200 EMA on the weekly chart), above which DXY remains in the long-term bull market zone.
At the same time, for the final break of the global bull trend of DXY, the price needs to break into the zone below support levels 94.40, 93.50 (144 EMA and 200 EMA on the monthly chart).
Overall, below the resistance levels of 103.70, 104.00, the dynamics are downward, suggesting a preference for short positions.
Support levels: 102.25, 102.00, 101.81, 101.50, 101.00, 100.80, 100.40, 100.00, 99.25, 99.00
Resistance levels: 102.71, 103.00, 103.45, 103.70, 104.00, 105.00, 105.85
¡Los informes analíticos de InstaForex lo mantendrá bien informado de las tendencias del mercado! Al ser un cliente de InstaForex, se le proporciona una gran cantidad de servicios gratuitos para una operación eficiente.


