 Permanecer
Condiciones de negociación
Products
Herramientas


Trend-following analysis (picture 1)
On Wednesday, EUR/USD could retrace from 1.0733 (the level when yesterday's intraday candlestick closed) downward with the target at 1.0672, the lower fractal plotted by the red dotted line. Once this level is reached, traders could enter the market with long positions with the upward target at 1.0734, the 14.6% Fibonacci correction plotted by the red dotted line.
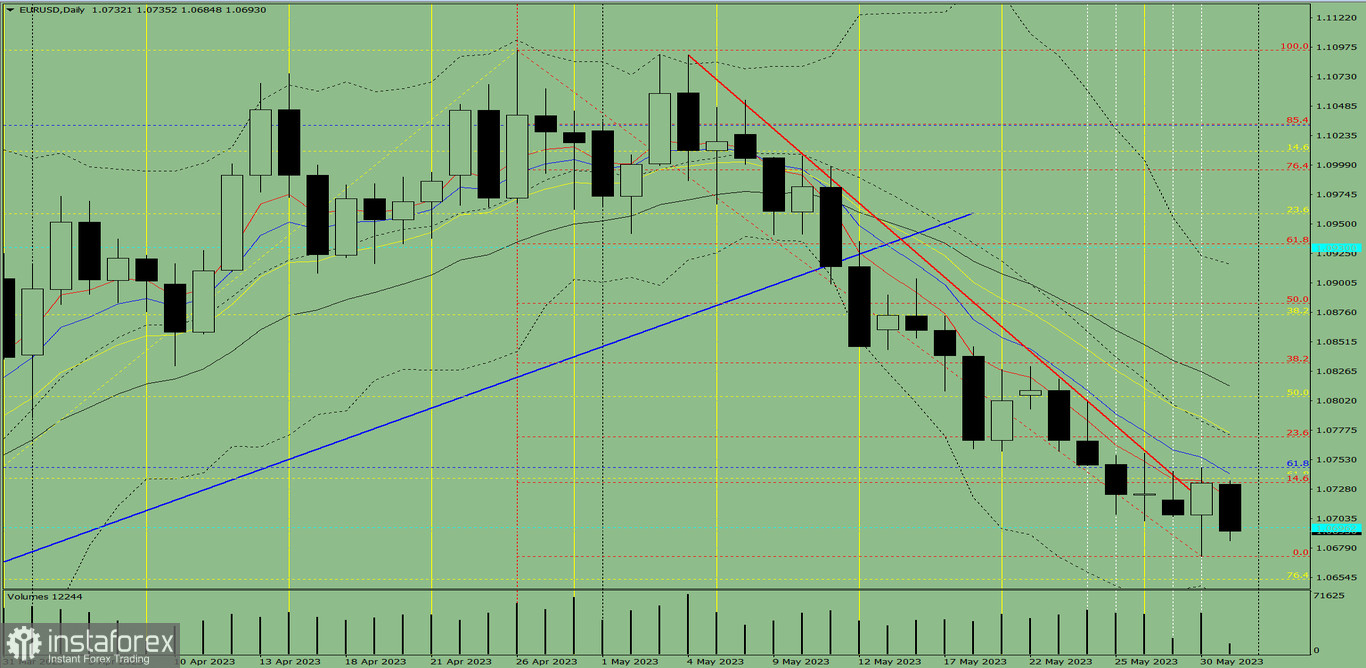
Picture 1: daily chart
Complex analysis
Indicator analysis – down
Fibonacci levels – down
Trading volumes – down
Trend-following analysis – down
Bollinger bands – down
Weekly chart – down
Conclusion
On Wednesday, EUR/USD could retrace from 1.0733 (the level of closing yesterday's intraday candlestick) downward with the target at 1.0672, the lower fractal plotted by the red dotted line. Once this level is reached, traders could enter the market with long positions with the upward target at 1.0734, the 14.6% Fibonacci correction plotted by the red dotted line.
Alternative scenario. From 1.0733 (the level of closing yesterday's daily candlestick), the instrument could retrace downward with the target at 1.0652 which is the 76.4% Fibonacci correction plotted by the yellow dotted line. After this level is hit, traders could continue with their long positions with the upward target at 1.0734 which is a 14.6% Fibonacci correction plotted by the red dotted line.
¡Los informes analíticos de InstaForex lo mantendrá bien informado de las tendencias del mercado! Al ser un cliente de InstaForex, se le proporciona una gran cantidad de servicios gratuitos para una operación eficiente.


