 Permanecer
Condiciones de negociación
Products
Herramientas


EUR/USD
Analysis
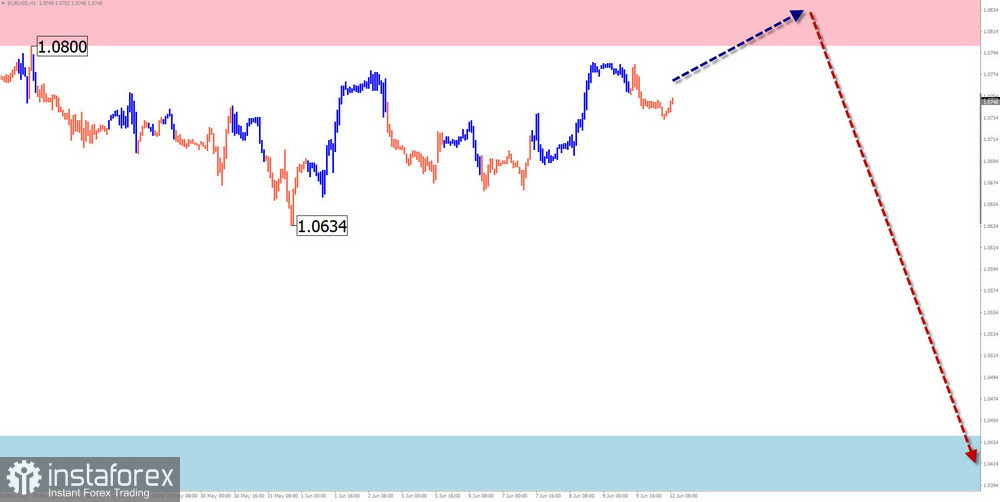
Judging by higher time frames, the euro has been developing an uptrend since September last year. In recent months, a flat section has appeared inside the wave pattern and it has not been completed yet. The price is holding near the interim resistance. Before moving further up, the instrument needs to advance to the next wave level.
Forecast
This week, the euro/dollar pair is likely to trade flat. In the middle of the weekly session, the price is likely to reverse from the resistance zone and move downwards. The correction may end at the estimated support level.
Potential reversal zones
Resistance:
- 1.0800/1.0850
Support:
- 1.0580/1.0530
Recommendations
Buy: no conditions for buying the pair are seen in the coming week.
Sell: going short may be possible with a fractional lot within a certain session provided that reversal signals are confirmed on the chart.
USD/JPY
Analysis
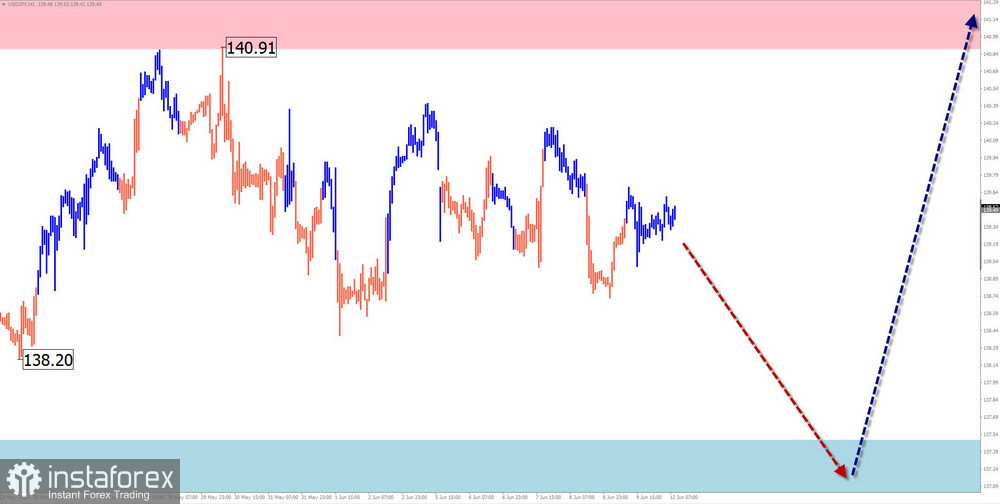
Since October last year, the dollar/yen pair has been trading inside the descending wave. For the whole year, a correction has also been developing inside the wave structure which has not been completed yet. In recent weeks, the quotes have been moving along the interim resistance zone, forming the horizontal pennant pattern.
Forecast
The pair is likely to trade sideways in the coming week, with a gradual decline towards the support area. Volatility may increase by the weekend, suggesting a possible reversal to the upside. The estimated resistance level may limit the pair's growth during the week.
Potential reversal zones
Resistance:
- 140.90/141.40
Support:
- 138.60/138.10
Recommendations
Sell: going short seems too risky and may lead to losses.
Buy: long positions will become relevant as soon as confirming signals appear near the support zone.
GBP/JPY
Analysis
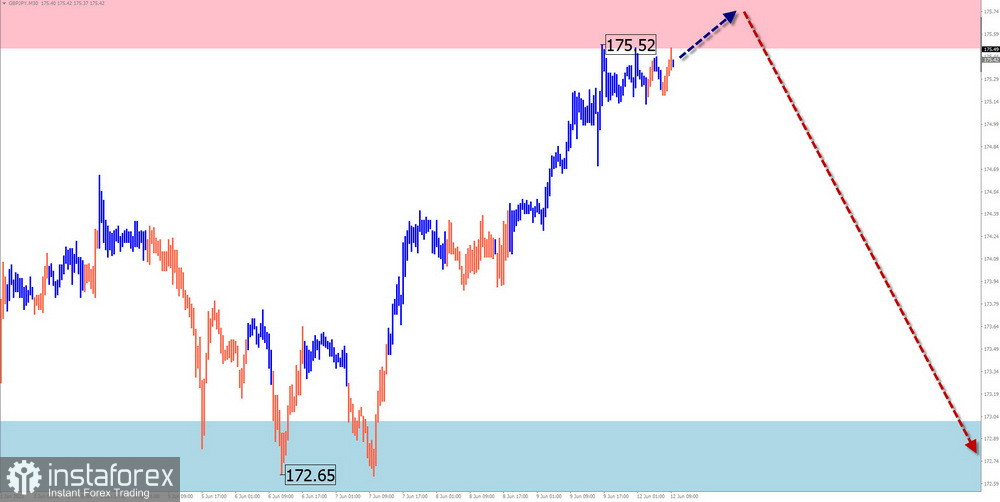
The pound/yen cross rate keeps moving upwards. The wave structure is coming to its final part. The price has reached the lower boundary of the potential reversal zone on the weekly chart. The wave analysis suggests the formation of a corrective structure.
Forecast
After testing the resistance zone at the start of the week, the pair is likely to reverse and decline to the estimated support area. Volatility may increase by the end of the week.
Potential reversal zones
Resistance:
- 175.50/176.00
Support:
- 173.00/172.50
Recommendations
Sell: selling the pair is not recommended unless there are signals confirming a reversal from the resistance level.
Buy: going long is too risky at the moment as losses are highly likely.
USD/CAD
Analysis
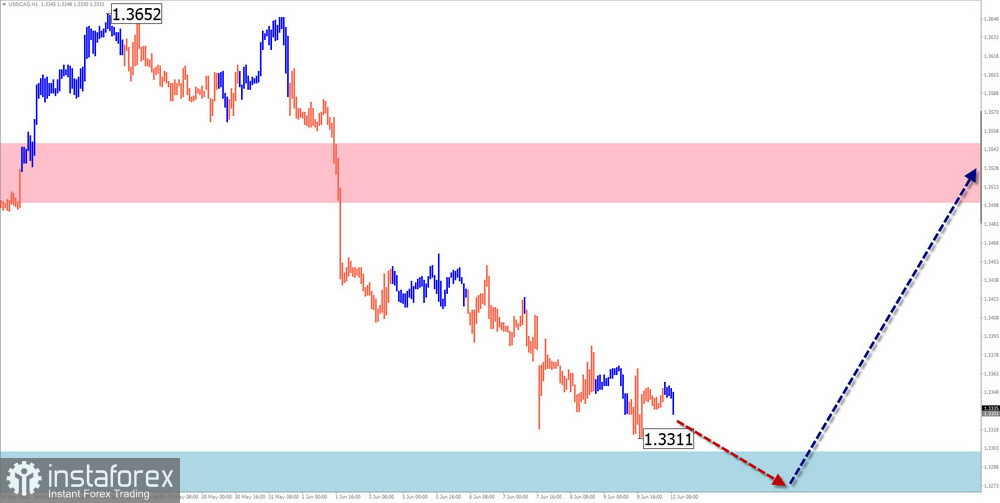
On the daily chart, the USD/CAD pair has been forming a horizontal pennant pattern since September last year. At the moment of writing, the wave structure looks complete. There are currently no signals predicting a reversal. The price has reached the upper boundary of the interim support zone on a higher time frame.
Forecast
In the coming days, bears may test the support area. Then the price may reverse and resume its rise up to the interim resistance on the daily chart.
Potential reversal zones
Resistance:
- 1.3500/1.3550
Support:
- 1.3300/1.3250
Recommendations
Sell: there are currently no conditions for opening short positions.
Buy: going long will be possible after relevant confirming signals appear on the chart.
NZD/USD
Analysis
The New Zealand dollar has been trading within a downtrend since December last year. The ascending section is viewed as a corrective movement. As soon as the correction is over, the pair will continue to decline.
Forecast
At the start of the week, the pair is likely to enter a sideways channel near the estimated resistance area. The price may change its direction if a reversal is formed. If so, the quotes may decline up to the estimated support area.
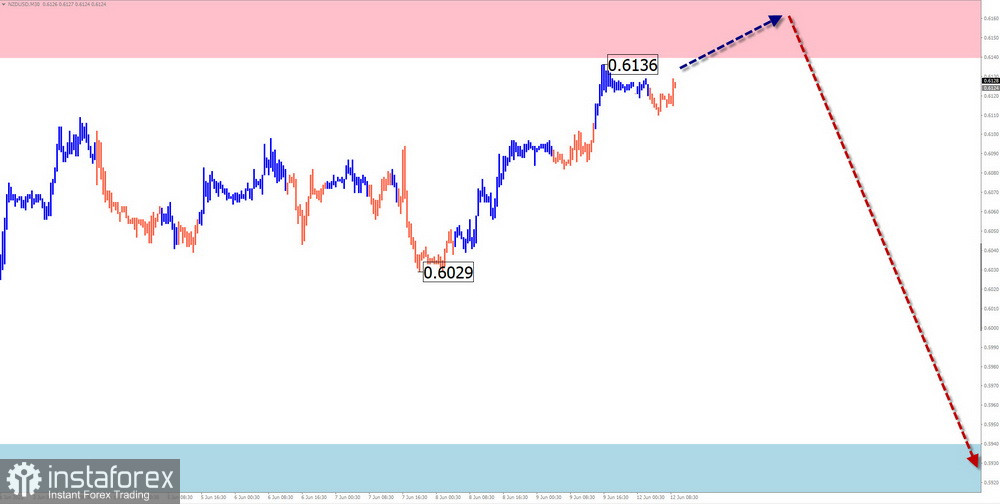
Potential reversal zones
Resistance:
- 0.6140/0.6190
Support:
- 0.5940/0.5890
Recommendations
Buy: going long seems too risky at the moment.
Sell: short positions can be opened when reversal signals appear at the resistance zone.
GOLD
Analysis
Gold has been trading in the uptrend since September last year. At the moment, the quote is moving sideways along the strong resistance level that was formed in early April. Given the prevailing wave structure, gold is likely to decline in the near term.
Forecast
The existing flat movement may continue throughout the coming week. The price is likely to test the estimated resistance level, with brief breakouts above the upper line. By the end of the week, the asset is likely to reverse and resume a decline.
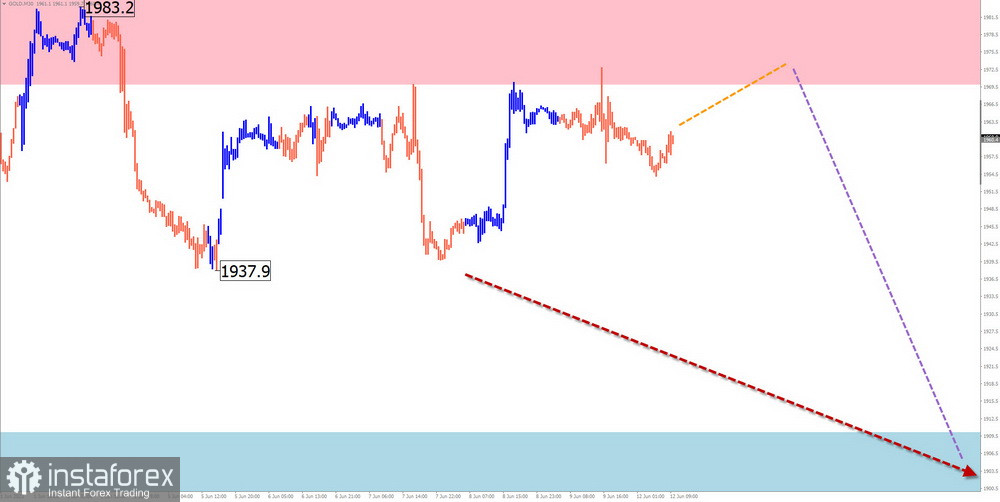
Potential reversal zones
Resistance:
- 1970.0/1985.0
Support:
- 1910.0/1895.0
Recommendations
Buy: there are currently no conditions for going long this week.
Sell: going short may be possible after relevant reversal signals are confirmed on the chart.
Explanation: in the simplified wave analysis, all waves consist of 3 parts (A-B-C). On each time frame, we analyze the most recent incomplete wave. The possible trajectory of the price is shown with dashed lines.
Please note: the wave analysis does not consider the duration of the price movement.
¡Los informes analíticos de InstaForex lo mantendrá bien informado de las tendencias del mercado! Al ser un cliente de InstaForex, se le proporciona una gran cantidad de servicios gratuitos para una operación eficiente.


