 Permanecer
Condiciones de negociación
Products
Herramientas


Today's reports from the U.S. Department of Labor and the Institute for Supply Management (ISM), especially the monthly Labor Department report with data for August, might become a pivotal moment for the dollar's dynamics in the upcoming weeks.
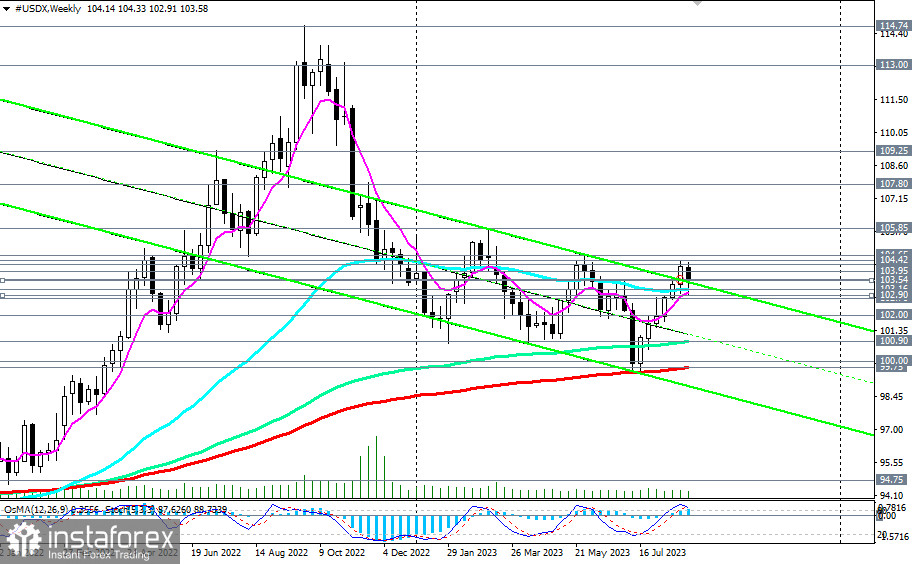
From a technical perspective, the DXY index (CFD #USDX in the MT4 terminal) is trading in the medium-term bull market zone, above the key level of 103.16 (200 EMA on the daily chart and 50 EMA on the weekly chart), and in the long-term—above the key levels of 100.00, 99.75 (200 EMA on the weekly chart).
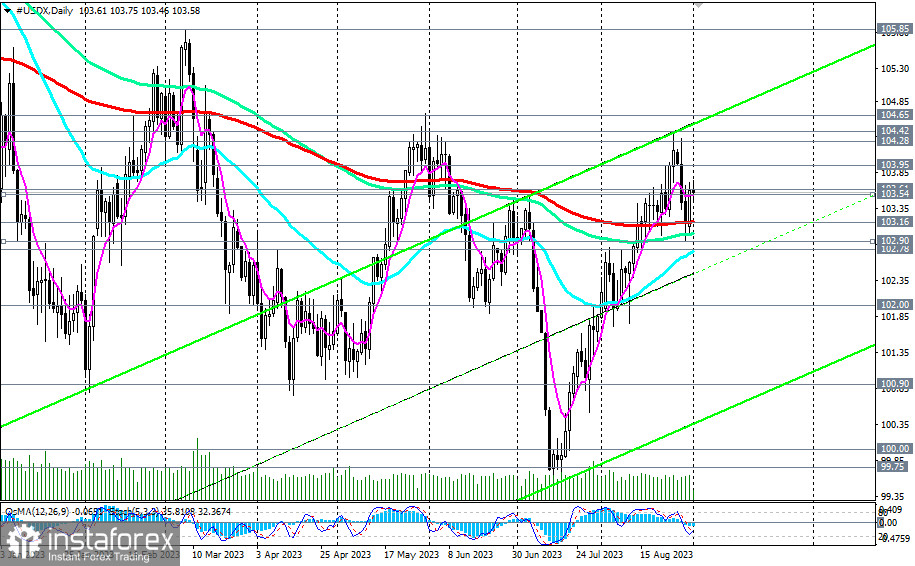
As we mentioned above, if the reports from the Department of Labor and the ISM show strong indicators, then after breaking the 103.73 mark, DXY will head towards last week's and August's high at the 104.38 level. Its breakout, in turn, could signal an increase in long positions with the prospect of rising to the March high at the 105.85 mark.
In an alternative scenario, a break below the key support level at 103.16 and the significant support level of 102.78 (50 EMA on the daily chart) will signal a renewal of the DXY's downward dynamics and short positions with targets at key support levels of 100.90 (144 EMA on the weekly chart), 100.00. A breach of the key support level of 99.75 (200 EMA on the weekly chart) will move DXY into the long-term bear market zone.
Support Levels: 103.54, 103.16, 103.00, 102.90, 102.78, 102.00, 101.00, 100.90, 100.00, 99.75
Resistance Levels: 103.61, 103.73, 103.95, 104.00, 104.38, 104.42, 104.65, 105.00, 105.85
¡Los informes analíticos de InstaForex lo mantendrá bien informado de las tendencias del mercado! Al ser un cliente de InstaForex, se le proporciona una gran cantidad de servicios gratuitos para una operación eficiente.


