 Permanecer
Condiciones de negociación
Products
Herramientas


Bitcoin's recent price action has painted a complex picture—a mix of bullish fundamental sentiment spurred by high-profile endorsements and a cautious technical setup signaling possible resistance ahead. Michael Saylor's unwavering commitment to Bitcoin echoes through the market as MicroStrategy's holdings swell, yet technical indicators suggest a moment of reflection for traders.

Fundamental Analysis:
On the fundamental front, Michael Saylor's latest interviews reveal an undimmed bullish outlook for Bitcoin. MicroStrategy's strategy of consistent Bitcoin accumulation, now totaling 190,000 BTC, underscores a deep-seated belief in Bitcoin's dominant market position. Saylor compares Bitcoin favorably to gold, the S&P 500, and even real estate.
The market sentiment is buoyed by the anticipation of Bitcoin ETFs and the upcoming halving event in April, historically a precursor to a bull market. Ethereum's breakthrough above $3,000 for the first time since 2021 adds further momentum to the broader digital asset market's spring rally.
Technical Analysis:
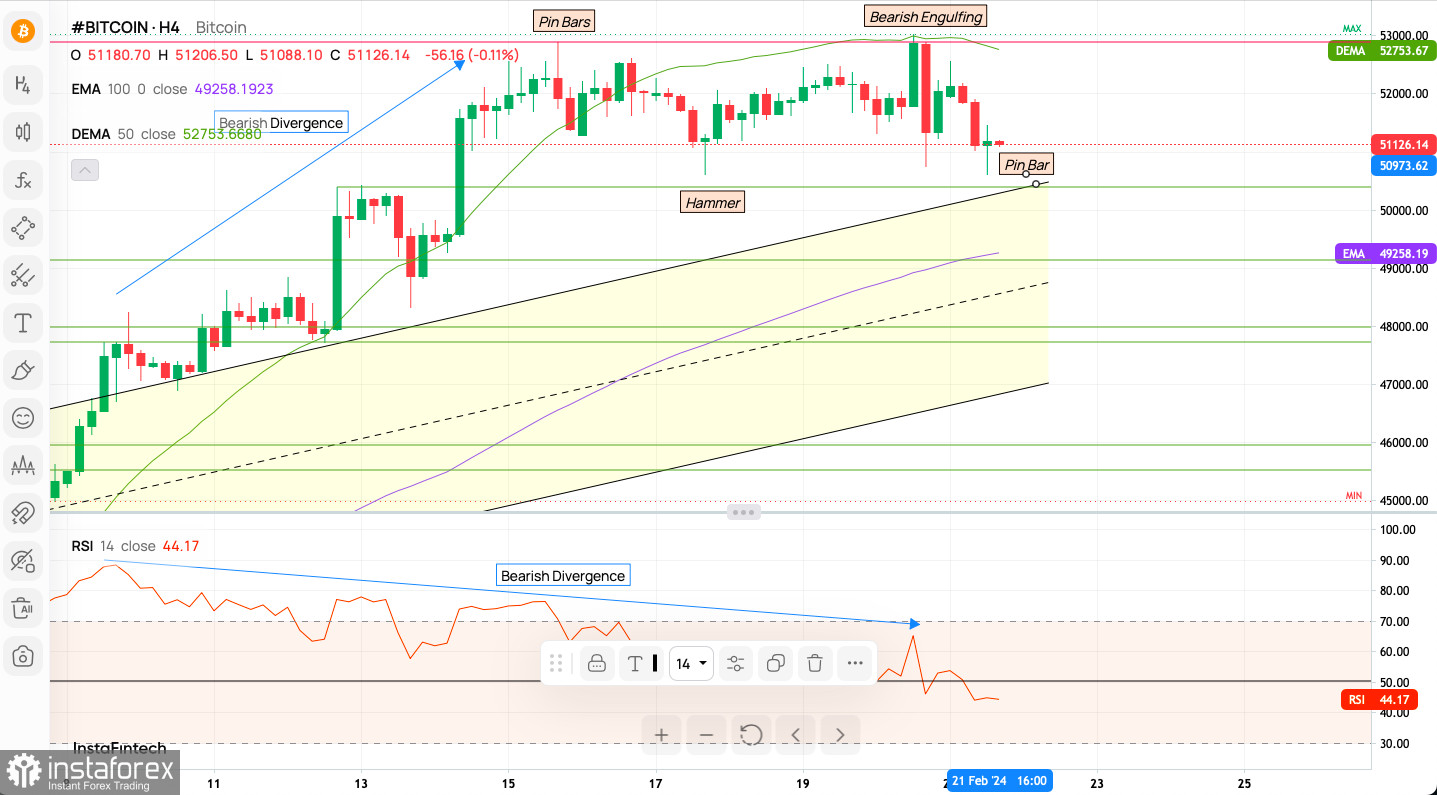
The 4-hour Bitcoin chart indicates a battle between bullish enthusiasm and technical resistance. Noteworthy is the 'Bearish Divergence' on the RSI, which often precedes a potential reversal or slowdown in upward momentum. The RSI currently reads at 44.17, edging into the lower half of the range and suggesting waning bullish power.
A 'Bearish Engulfing' candlestick pattern also emerges, adding weight to the cautionary tale told by the RSI. This is counterbalanced, however, by a preceding 'Hammer' and 'Pin Bar' formations—both hinting at an underlying resolve among buyers.
The current price hovers around the 50-period Double Exponential Moving Average (DEMA) at 52,753.67, with the 100-period Exponential Moving Average (EMA) at 49,258.19 serving as a significant support zone. These levels are critical, as a decisive break or bounce could signal the market's next move.
Despite the optimistic tone from industry leaders, the Intraday 1H Indicator Signals present a contrasting narrative:
Yet, the Sentiment Scoreboard remains decidedly bullish, with 73% bulls vs. 27% bears, an increase from the already bullish sentiment seen last week and over the past three days.
Traders should weigh the bullish fundamental narrative against the caution suggested by technical indicators. The market may be at a juncture where high conviction meets technical trepidation. A hold above the weekly pivot at $52,175 could validate the bulls' stance, while a slip below WS2 at $51,597 might confirm the bearish signals from the technical indicators.
Scenario for Bulls: A bullish push that overcomes the DEMA at $52,753.67 and challenges WR2 could see Bitcoin aiming for WR3 at $53,330, affirming Saylor's bullish thesis.
Scenario for Bears: Conversely, a pullback with a close below the pivotal $51,597 (WS2) could indicate a short-term bearish shift, potentially opening a path to test the solid support of the 100 EMA near $49,258.
Conclusion: The current Bitcoin landscape is a tapestry of contrasting signals. While Saylor's commitment provides a fundamental backbone for continued bullishness, technical indicators inject a note of caution into the mix. The coming weeks will be critical in determining whether Bitcoin will sustain its upward trajectory or succumb to technical pressures.
The begginers in forex trading need to be very careful when making decisions about entering the market. Before the release of important reports, it is best to stay out of the market to avoid being caught in sharp market fluctuations due to increased volatility. If you decide to trade during the news release, then always place stop orders to minimize losses.
Without placing stop orders, you can very quickly lose your entire deposit, especially if you do not use money management and trade large volumes. For successful trading, you need to have a clear trading plan and stay focues and disciplined. Spontaneous trading decision based on the current market situation is an inherently losing strategy for a scalper or daytrader.
¡Los informes analíticos de InstaForex lo mantendrá bien informado de las tendencias del mercado! Al ser un cliente de InstaForex, se le proporciona una gran cantidad de servicios gratuitos para una operación eficiente.


