 Permanecer
Condiciones de negociación
Products
Herramientas


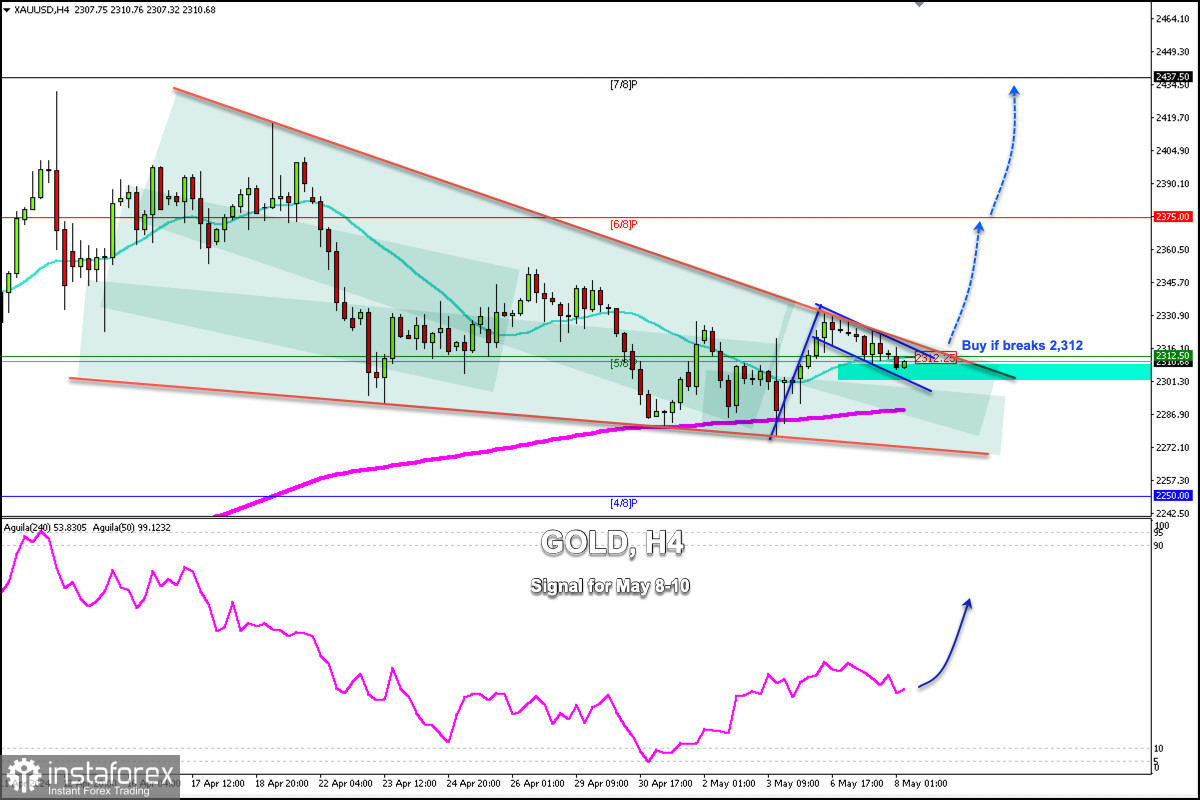
Early in the European session, gold is trading around 2,310.68 forming a bearish bullish pennant pattern on the H4 chart.
Gold has been trading within a symmetrical triangle pattern formed since April 12. We believe that if there is a sharp break above 2,312 and consolidation above this area on the daily chart, gold could continue its rise and could reach 6/ 8 Murray at 2,375 and finally, 7/8 Murray around 2,437.
On April 18, gold left a GAP at about 2,392. If an upward movement occurs in the next few days and if gold consolidates above 2,375, the instrument could cover this GAP and even reach the psychological level of 2,400.
On the contrary, if gold falls and consolidates below the 21 SMA located at 2,312 and below 5/8 Murray, we could expect it to reach the 200 EMA located at 2,295. The price could reach the bottom of the symmetrical triangle pattern around of 2,270.
Since the beginning of May, the eagle indicator has been showing a positive signal and we believe that an upward movement in gold could occur in the coming days. For this scenario to be confirmed, we must wait for the double break of the bullish flag and symmetrical triangle pattern.
If this scenario comes true, it will be seen as an opportunity to buy. On the contrary, we could continue selling below 2,310.
¡Los informes analíticos de InstaForex lo mantendrá bien informado de las tendencias del mercado! Al ser un cliente de InstaForex, se le proporciona una gran cantidad de servicios gratuitos para una operación eficiente.


