 Permanecer
Condiciones de negociación
Products
Herramientas

USD/JPY
Yesterday, the USD/JPY pair fell with the Marlin oscillator rising. This was likely the pair's last movement before an upcoming corrective rise. If so, the price has formed a new support level at 146.24.
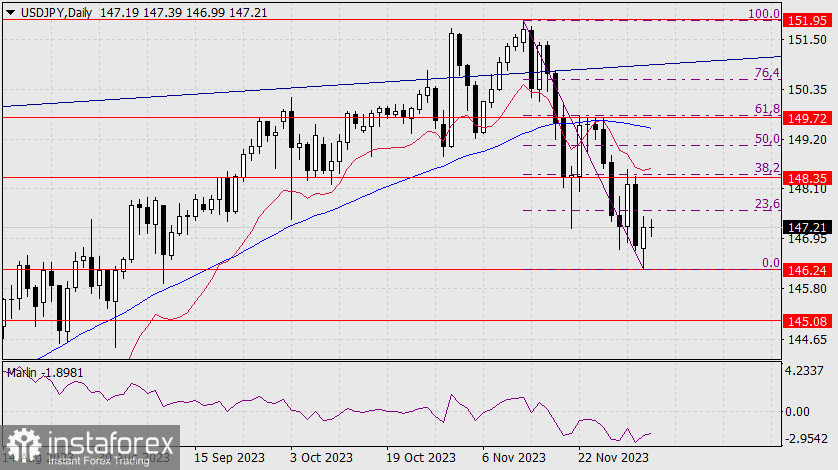
Rising towards the first resistance at 148.35 would correspond to a 38.2% Fibonacci retracement. Further growth to 149.72 (the peak on November 24) would correspond to a 61.8% retracement. If the price manages to continue its downward movement, breaking below 148.24, it may aim for 145.08 (the peak on June 30).
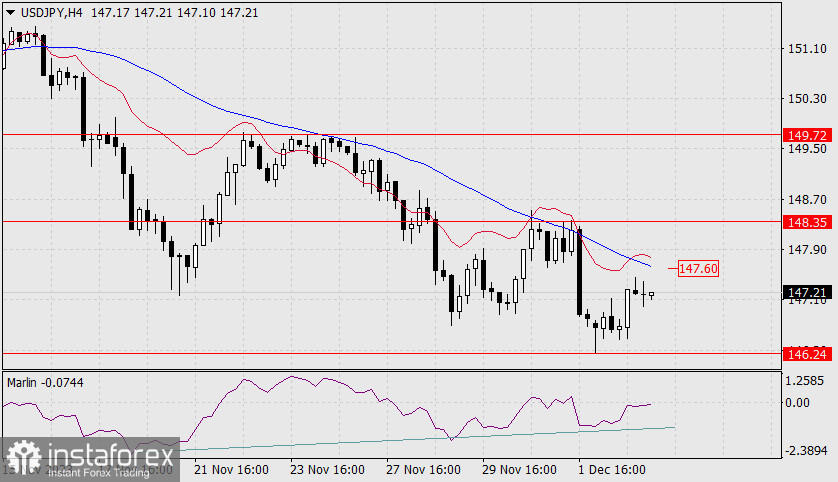
On the 4-hour chart, the price and Marlin oscillator have formed a double convergence. If the price rises above the MACD line (147.60), also corresponding to breaking above the 23.6% Fibonacci level on the daily chart, the nearest bullish target would be 148.35. Consolidation above this level means that the next target will be 149.72.
¡Los informes analíticos de InstaForex lo mantendrá bien informado de las tendencias del mercado! Al ser un cliente de InstaForex, se le proporciona una gran cantidad de servicios gratuitos para una operación eficiente.


