 Permanecer
Condiciones de negociación
Products
Herramientas


On Tuesday, final inflation data for the Eurozone was published, showing a slowdown to 2.4% in November. However, actual figures matched the preliminary estimate that had already been priced in. For this reason, the market ignored such crucial statistical data.
Speculators paid attention to the statement by ECB representative Andrea Enria. He noted that the question of reducing interest rates should be considered only if inflation slows down to 2.0%. Despite the decrease in inflation, it is still above this threshold. Thus, the ECB may start reducing interest rates after the Federal Reserve. This process is likely to be gradual, once again creating the prospect of a change in the interest rate disparity in favor of Europe. Therefore, the ECB's interest rate level may be higher than that of the Federal Reserve, contributing to the rise of the euro.

Analysis of Trading Charts from December 19
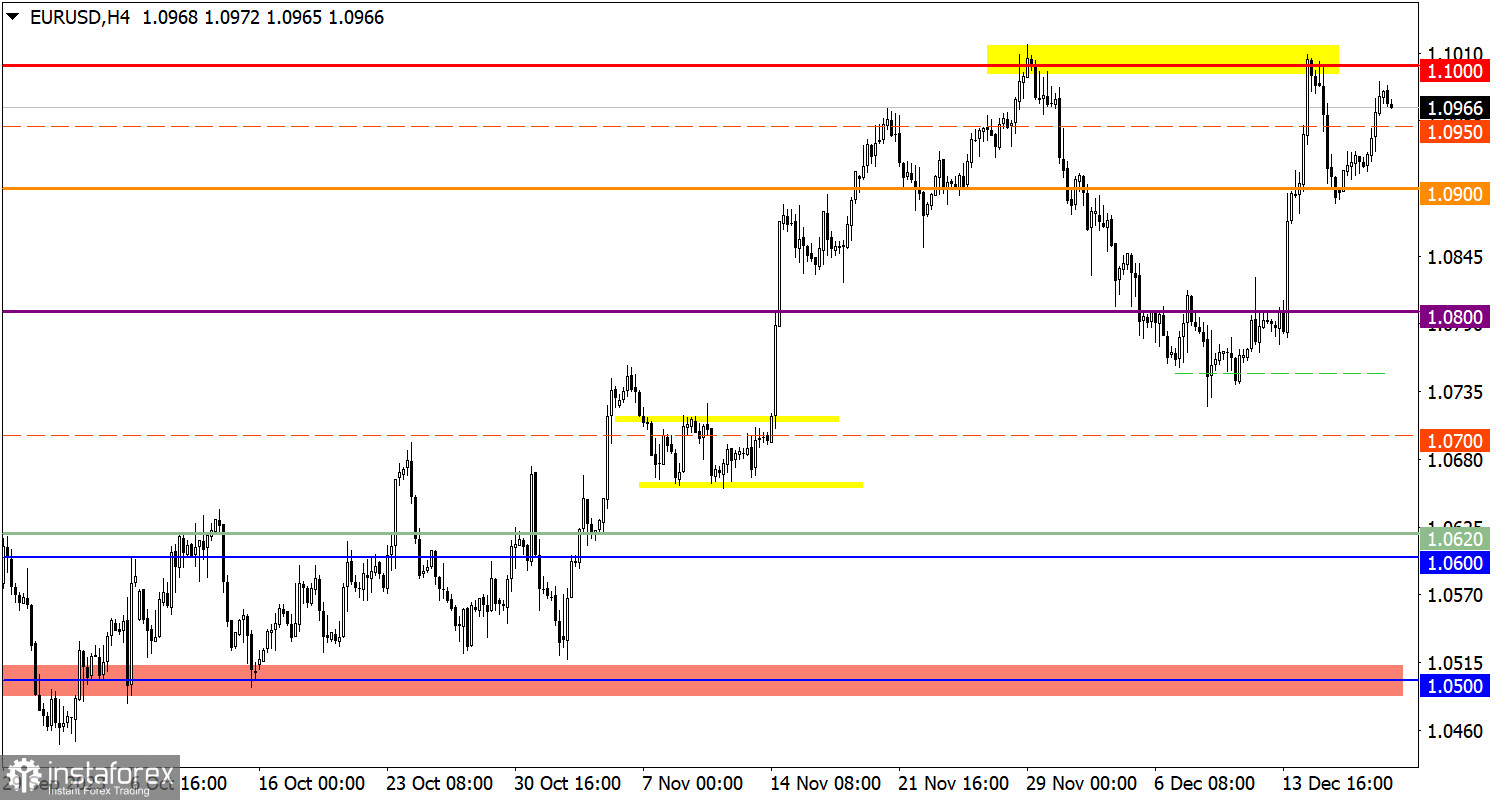
The EUR/USD currency pair completed the correction phase around the 1.0900 level, where the volume of short positions decreased. As a result, the recovery of the euro rate began, based on which the quote almost returned to the resistance level of 1.1000.
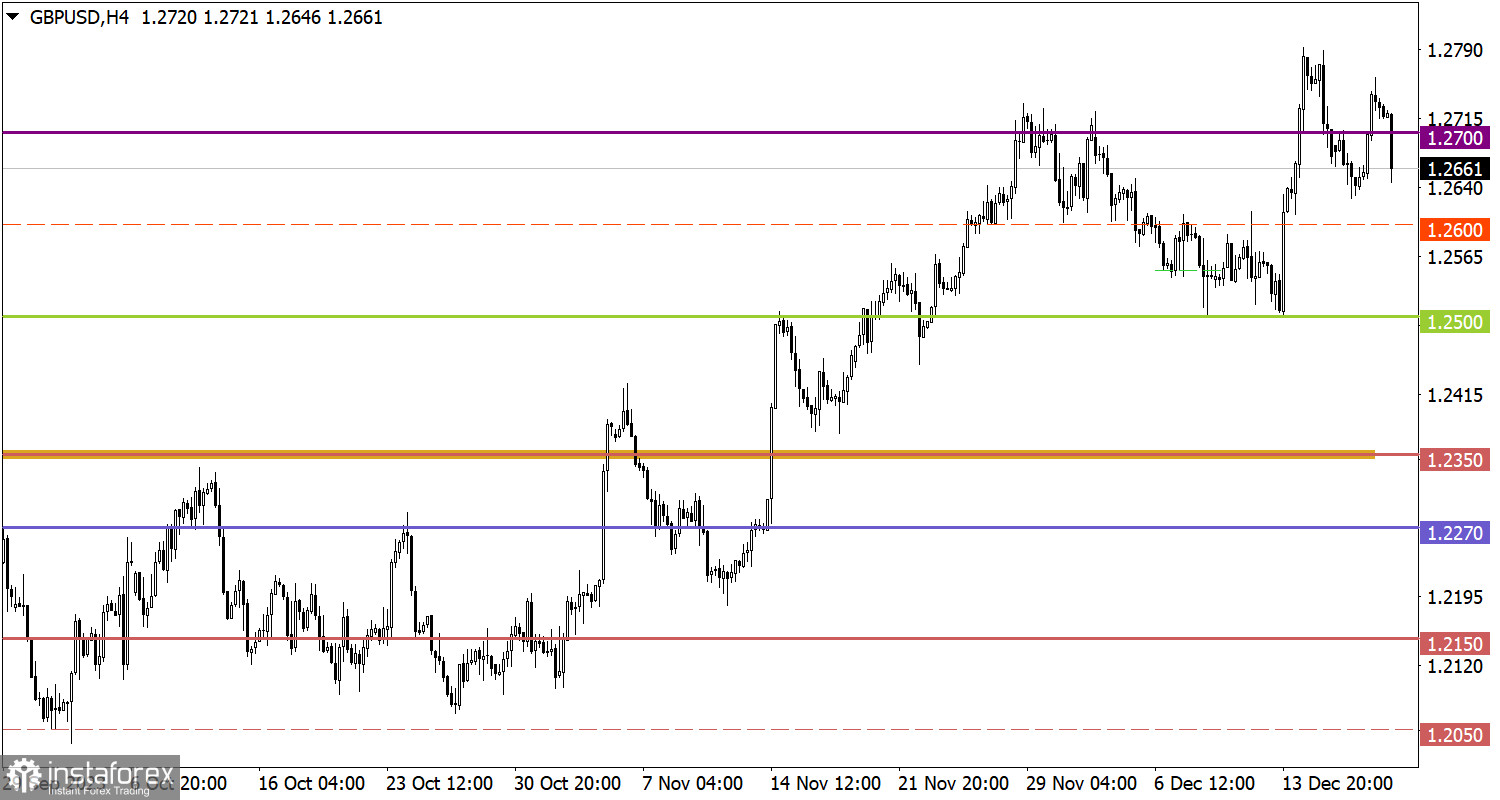
The GBP/USD pair, following the euro, rose rapidly. As a result, the quote rose above the 1.2700 level.
Economic Calendar on December 20
Today, at the opening of European platforms, inflation data in the UK was published. Consumer Price Index was expected to slow down from 4.6% to 4.3%, but actual data fell to 3.9%. Thus, the Bank of England will no longer be able to avoid the question of lowering the interest rate. The reaction of the British pound was corresponding, sharply shifting to a decline.
EUR/USD Trading Plan for December 20
For the further rise of the euro-dollar pair, the stabilization of the price above the 1.1000 level is important. This step will lead to a new wave of growth in the volume of long positions, indicating the extension of the upward trend. In the case of a possible downward scenario, traders may consider this option on the next price rebound from the resistance level of 1.1000. It is important to note that, despite the recent correction and a possible price rebound, the market maintains an upward trend, confirmed by the sequence of corrections and pullbacks.
GBP/USD Trading Plan for December 20
With the opening of trading in Europe, speculation about the British currency arose, triggered by the publication of inflation data. The quote momentarily loses about 70 points in value, leading to a complete restoration of short positions. In case of stabilization of the price below 1.2640, an extension of the downward cycle is possible. Otherwise, the quote will return to the 1.2700 level.
What's on the charts
The candlestick chart type is white and black graphic rectangles with lines above and below. With a detailed analysis of each individual candle, you can see its characteristics relative to a particular time frame: opening price, closing price, intraday high and low.
Horizontal levels are price coordinates, relative to which a price may stop or reverse its trajectory. In the market, these levels are called support and resistance.
Circles and rectangles are highlighted examples where the price reversed in history. This color highlighting indicates horizontal lines that may put pressure on the asset's price in the future.
The up/down arrows are landmarks of the possible price direction in the future.
¡Los informes analíticos de InstaForex lo mantendrá bien informado de las tendencias del mercado! Al ser un cliente de InstaForex, se le proporciona una gran cantidad de servicios gratuitos para una operación eficiente.


