 Permanecer
Condiciones de negociación
Products
Herramientas


Trend analysis (Fig. 1).
The GBP/USD currency pair may move upward from the level of 1.2747 (closing of Friday's daily candlestick) to 1.2790, the historical resistance level (blue dotted line). From this level, a continued upward movement is possible to the upper fractal at 1.2828 (daily candle from 28/12/2023).
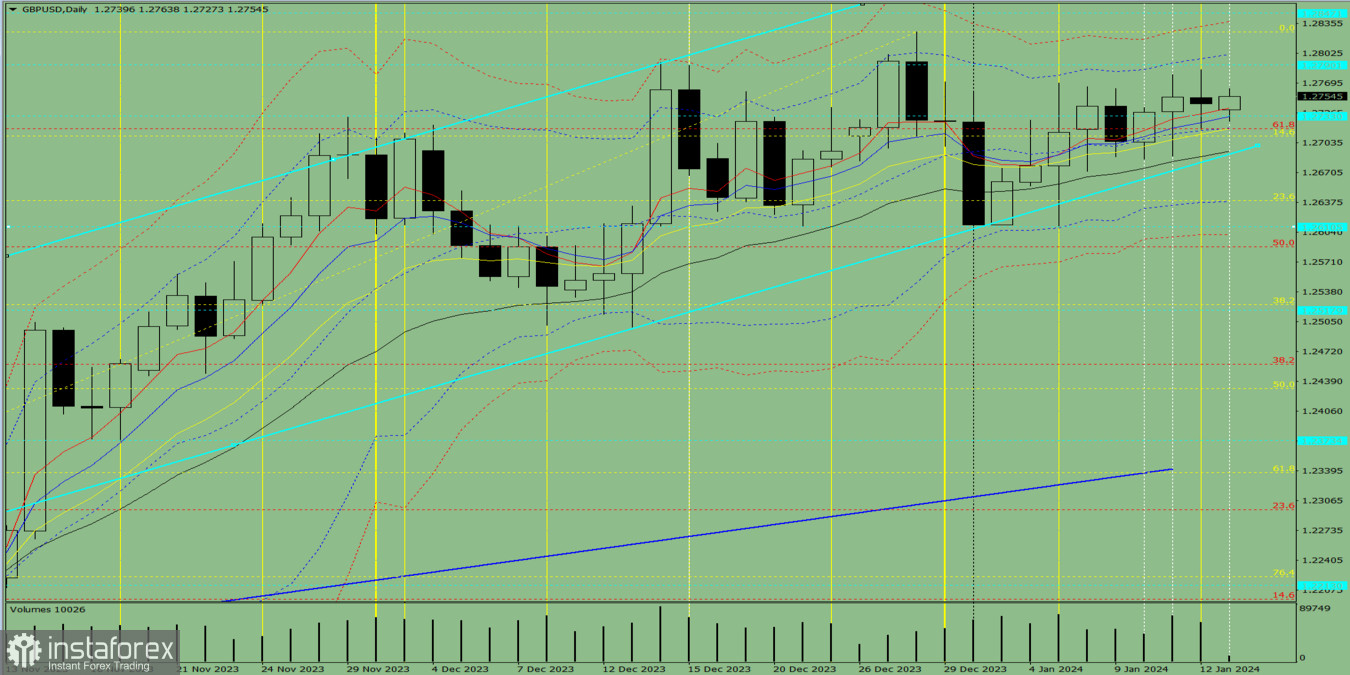
Fig. 1 (daily chart).
Comprehensive analysis:
General conclusion: Today, the price may move upward from the level of 1.2747 (closing of Friday's daily candlestick) to 1.2790, the historical resistance level (blue dotted line). From this level, a continued upward movement is possible to the upper fractal at 1.2828 (daily candle from 28/12/2023).
Alternatively, the price may move upward from level of 1.2747 (closing of Friday's daily candlestick) to 1.2790, the historical resistance level (blue dotted line). Then, the price may decline with the target at 1.2733, the historical support level (blue dotted line).
¡Los informes analíticos de InstaForex lo mantendrá bien informado de las tendencias del mercado! Al ser un cliente de InstaForex, se le proporciona una gran cantidad de servicios gratuitos para una operación eficiente.


