 Permanecer
Condiciones de negociación
Products
Herramientas


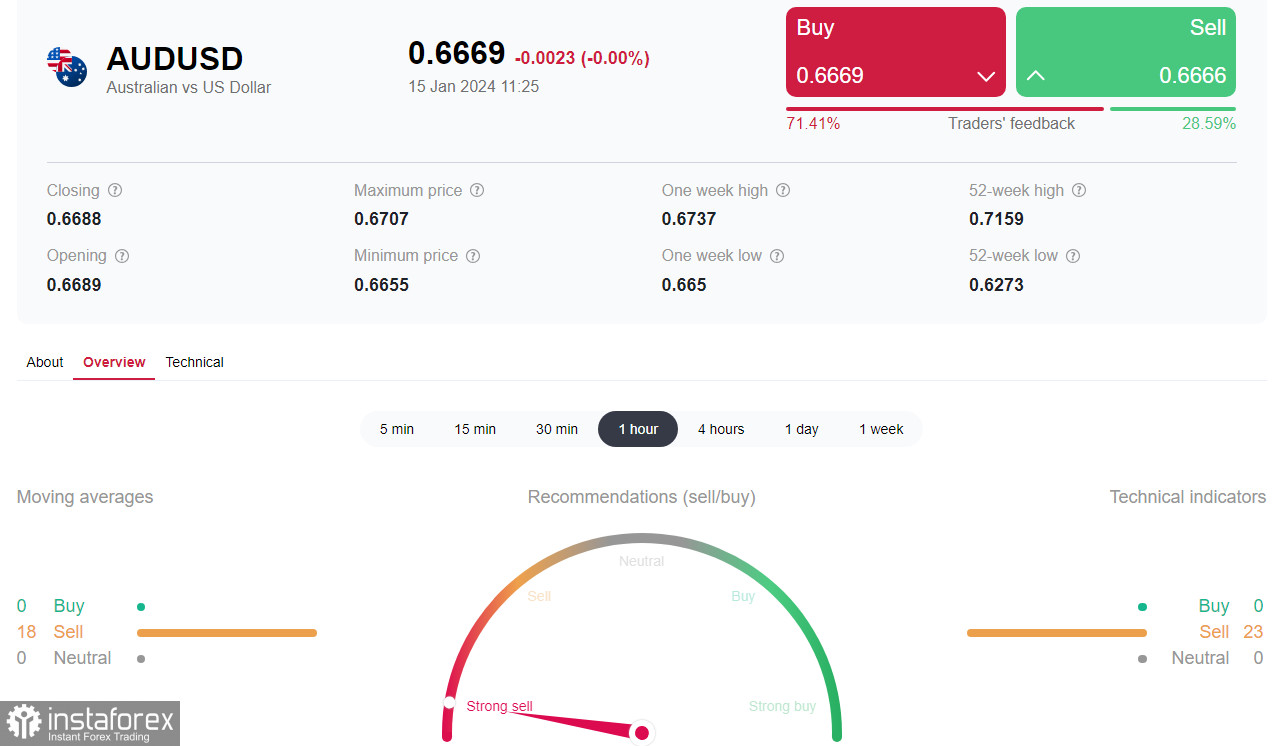
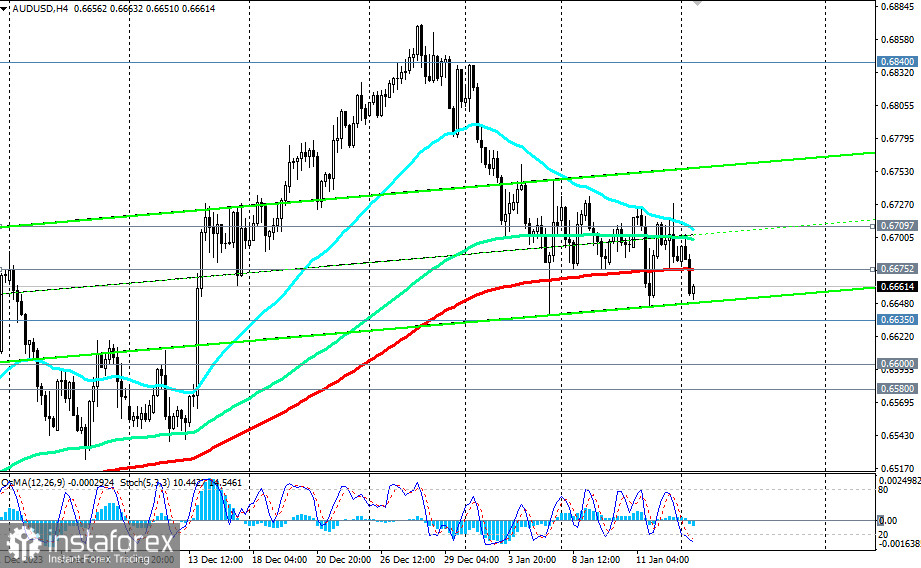
AUD/USD intensifies the downward momentum after breaking through another important short-term support level of 0.6675 (200 EMA on the 4-hour chart) at the beginning of today's European trading session.
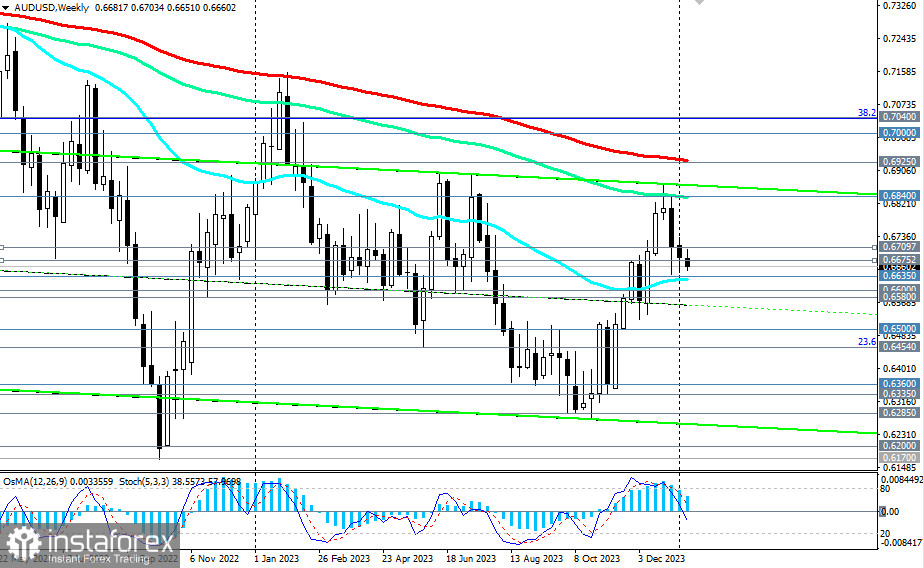
At the same time, technical indicators OsMA and Stochastic on the 4-hour, daily, and weekly charts have turned towards short positions, siding with the sellers.
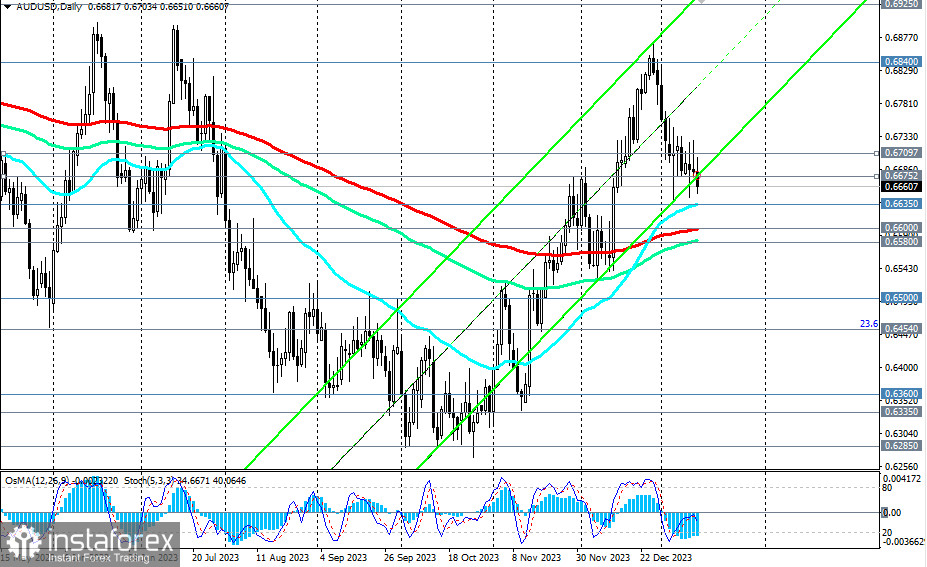
The nearest target in case of further decline would be the important support level of 0.6635 (50 EMA on the daily chart). Breaking through it, in turn, would open the way towards the key medium-term support level of 0.6600 (200 EMA on the daily chart). Further decline and breaking through another important medium-term support level of 0.6580 (144 EMA on the daily chart) would lead AUD/USD into the medium-term bearish market zone with the potential of dropping to multi-month lows near the 0.6300 mark.
In an alternative scenario, AUD/USD will break through the key long-term resistance level of 0.6925 (200 EMA on the weekly chart) and head towards the important resistance level of 0.7505 (200 EMA on the monthly chart at the 50.0% Fibonacci retracement level of the decline wave from the level of 0.9500 to 0.5510). Breaking above these levels will lead AUD/USD into the global bull market zone.
The first signal for realizing this scenario will be on the breakout of the 0.6675 resistance level, and the confirmation will be the breakout of the 0.6710 resistance level (200 EMA on the 1-hour chart) and the resistance zone near the 0.6730 mark.
Support levels: 0.6635, 0.6600, 0.6580, 0.6500, 0.6454, 0.6400, 0.6360, 0.6335, 0.6300, 0.6285, 0.6200, 0.6170
Resistance levels: 0.6675, 0.6710, 0.6730, 0.6800, 0.6840, 0.6900, 0.6925, 0.7000, 0.7040
Trading Scenarios
Main scenario: Sell Stop 0.6645. Stop-Loss 0.6715. Targets 0.6635, 0.6600, 0.6580, 0.6500, 0.6454, 0.6400, 0.6360, 0.6335, 0.6300, 0.6285, 0.6200, 0.6170
Alternative scenario: Buy Stop 0.6715. Stop-Loss 0.6645. Targets 0.6730, 0.6800, 0.6840, 0.6900, 0.6925, 0.7000, 0.7040
'Targets' correspond to support/resistance levels. This also does not mean that they will necessarily be reached, but can serve as a guide in planning and placing your trading positions.
¡Los informes analíticos de InstaForex lo mantendrá bien informado de las tendencias del mercado! Al ser un cliente de InstaForex, se le proporciona una gran cantidad de servicios gratuitos para una operación eficiente.


