 Permanecer
Condiciones de negociación
Products
Herramientas


After the pound reached the upper boundary of the range, where it has been for the past couple of weeks, it seemed that the pair should have gradually moved towards the lower boundary, especially since the economic calendar was empty on Monday. However, nothing of the sort happened. On the contrary, locally, the market even tried to push GBP/USD higher. However, they failed, and quotes quickly retreated to their previous values. But today, the market is unlikely to maintain balance due to the Eurozone Producer Price data, which may provide fresh impetus. Moreover, the pace of the decline is foreseen to slow from -10.6% to -7.4%. To some extent, this indicates a gradual normalization of inflationary process in the eurozone. This means that the European Central Bank will likely start easing its monetary policy soon. Therefore, the euro should eventually decline, pulling the pound down with it. However, we don't expect crucial changes, and the market will simply shift towards the lower boundary of the range.
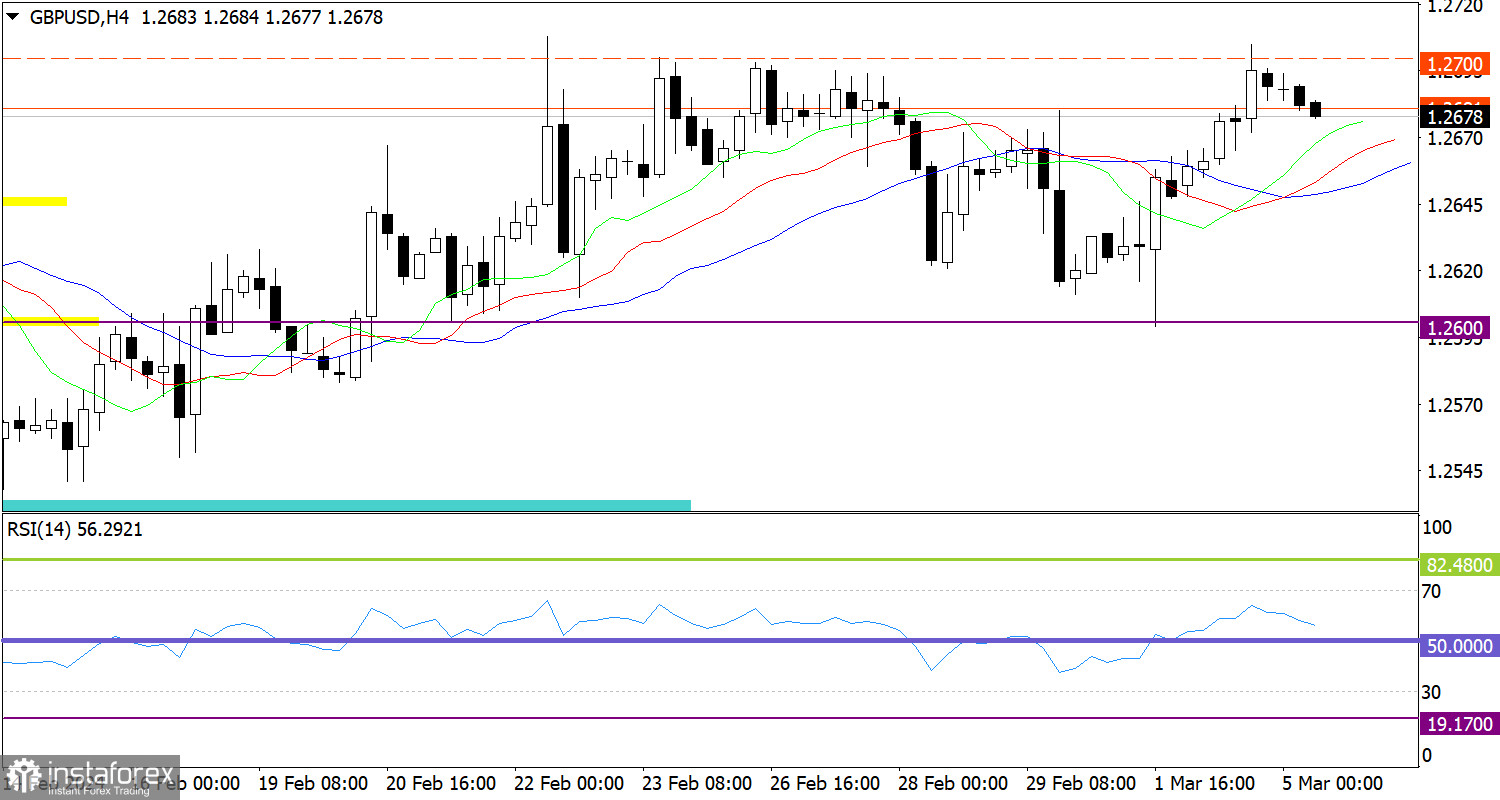
The GBP/USD pair is trading between the levels of 1.2600 and 1.2700. Despite fairly high dynamics, the quote is moving within the range, which indicates uncertainty regarding the pair's succeeding movement.
On the four-hour chart, the RSI technical indicator is hovering in the upper area of 50/70. Currently, the indicator's movement is comparable to the price fluctuations within the range.
On the same chart, the Alligator's MAs are headed upwards, but this only means that the price reached the resistance level of 1.2700.
In this case, the level of 1.2700 will act as resistance for the buyers, making it possible for traders to expect that the price may rebound, along with a gradual increase in the volume of short positions. The bullish scenario will come into play in case the price settles above 1.2700 during the day. In this case, the pair may leave the sideways range of 1.2600/1.2700.
In terms of complex indicator analysis, a price rebound is likely in the short term period. Indicators also signal an uptrend in the intraday period.
¡Los informes analíticos de InstaForex lo mantendrá bien informado de las tendencias del mercado! Al ser un cliente de InstaForex, se le proporciona una gran cantidad de servicios gratuitos para una operación eficiente.

