 Permanecer
Condiciones de negociación
Products
Herramientas


Trend analysis
GBP/USD may start moving upward this week, from the level of 1.2731 (closing price of the last weekly candle) to the 14.6% retracement level of 1.2766 (yellow dashed line). After that it will likely approach the 76.4% retracement level of 1.2880 (red dashed line).
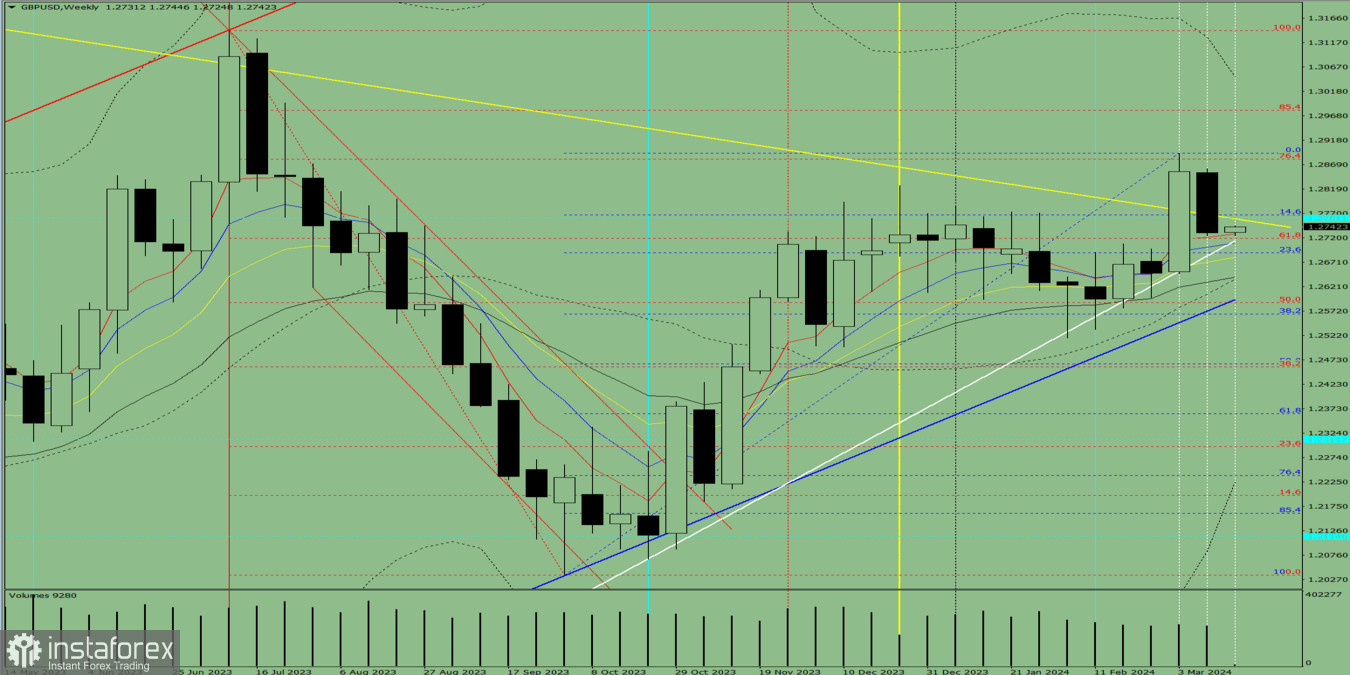
Fig. 1 (weekly chart)
Comprehensive analysis:
Indicator analysis - upward
Fibonacci levels - upward
Volumes - upward
Candlestick analysis - upward
Trend analysis - upward
Bollinger bands - upward
Monthly chart - upward
Conclusion: The indicators point to an upward movement in GBP/USD.
Overall conclusion: The pair will have a bullish trend, with no first lower shadow on the weekly white candle (Monday - upward) and a second upper shadow (Friday - downward).
So, during the week, pound will rise from 1.2731 (closing price of the last weekly candle) to the 14.6% retracement level of 1.2766 (yellow dashed line), and then move towards the 76.4% retracement level of 1.2880 (red dashed line).
Alternatively, it could climb from 1.2731 (closing price of the last weekly candle) to the 14.6% retracement level of 1.2766 (yellow dashed line), followed by a retreat down to the 61.8% retracement level of 1.2719 (red dashed line).
¡Los informes analíticos de InstaForex lo mantendrá bien informado de las tendencias del mercado! Al ser un cliente de InstaForex, se le proporciona una gran cantidad de servicios gratuitos para una operación eficiente.

