 Permanecer
Condiciones de negociación
Products
Herramientas


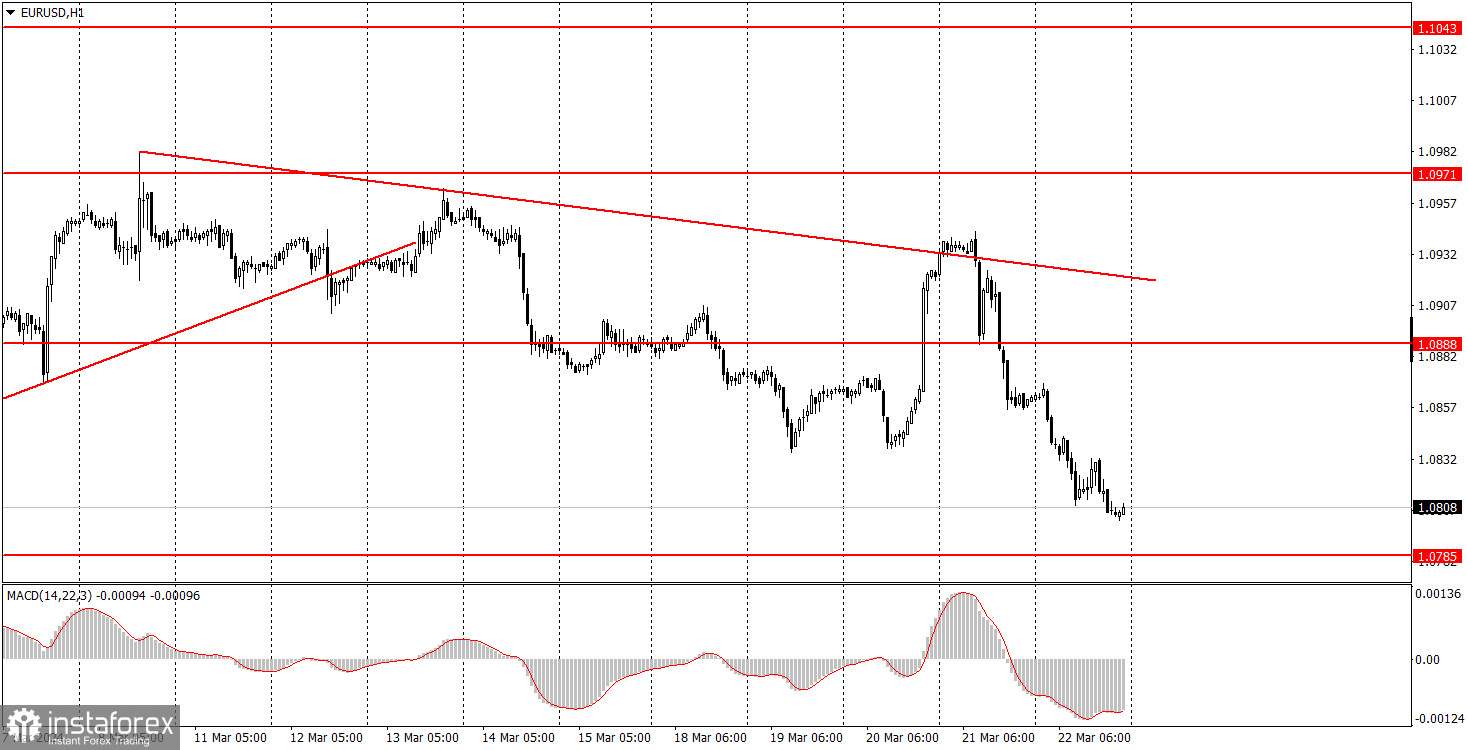
On Friday, EURUSD continued to trade lower. The macroeconomic background was quite weak, and there was no fundamental aspect. Nevertheless, the pair showed quite decent volatility. The market became active on Wednesday evening when the results of the Federal Reserve meeting were announced. We mentioned that it was best not to draw hasty conclusions, and wait until Thursday to analyze the market's reaction. The US central bank meeting wasn't dovish, and Fed Chair Jerome Powell did not exactly soften his stance. Therefore, there were no reasons for the dollar to decline on Wednesday. So what happened on Thursday and Friday then? The market reinterpreted the results of the meeting, drew the right conclusions, and rushed to buy the dollar at an even more favorable rate than on Wednesday evening. This triggered the dollar's growth on Friday. We still consider the descending trend line relevant, despite the breakthrough on Wednesday.
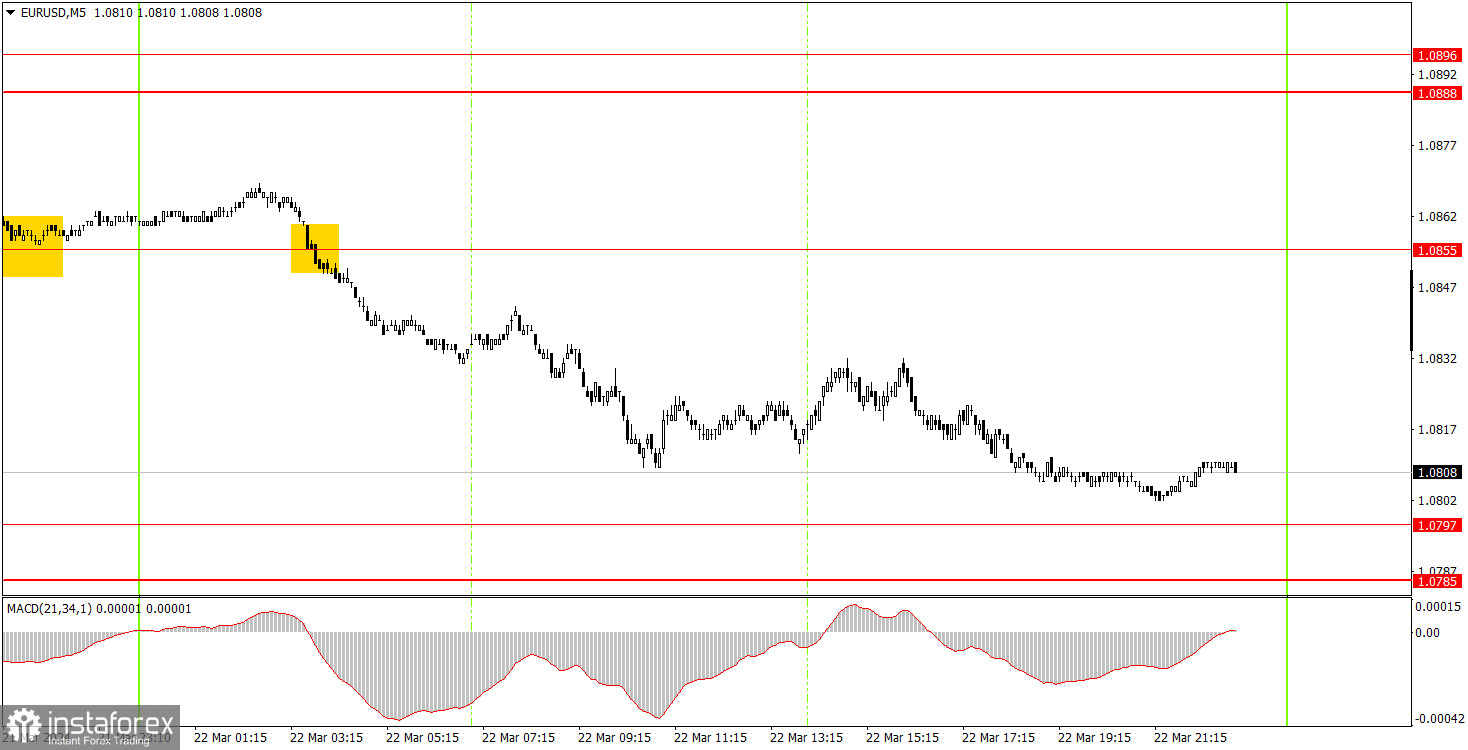
Only one trading signal was generated on the 5-minute timeframe. During the Asian trading session, the price broke the level of 1.0855 and then it fell throughout the day. Unfortunately, it failed to reach the nearest target of 1.0797. One could only enter a short position at the opening of the European session (if, of course, you don't trade at night). In this case, you could also make a decent profit.
On the hourly chart, EUR/USD resumed its downward movement, which corresponds to the week's fundamental background. We believe that the euro should fall further, as the price is still too high, and the global trend is downward. Unfortunately, the market doesn't always want to trade the pair in a logical manner, and from time to time, we observe unjustified growth.
The key levels on the 5M chart are 1.0568, 1.0611-1.0618, 1.0668, 1.0725, 1.0785-1.0797, 1.0855, 1.0888-1.0896, 1.0940, 1.0971-1.0981, 1.1011, 1.1043, 1.1091. On Monday, European Central Bank President Christine Lagarde will speak, but we don't expect her to share new information. The ECB meeting has recently taken place, and Lagarde has already announced all the most important information. Also, several of her colleagues have spoken over the past couple of weeks, so we have a clear understanding of what to expect from the ECB in the coming months.
1) Signal strength is determined by the time taken for its formation (either a bounce or level breach). A shorter formation time indicates a stronger signal.
2) If two or more trades around a certain level are initiated based on false signals, subsequent signals from that level should be disregarded.
3) In a flat market, any currency pair can produce multiple false signals or none at all. In any case, the flat trend is not the best condition for trading.
4) Trading activities are confined between the onset of the European session and mid-way through the U.S. session, after which all open trades should be manually closed.
5) On the 30-minute timeframe, trades based on MACD signals are only advisable amidst substantial volatility and an established trend, confirmed either by a trendline or trend channel.
6) If two levels lie closely together (ranging from 5 to 15 pips apart), they should be considered as a support or resistance zone.
Support and Resistance price levels can serve as targets when buying or selling. You can place Take Profit levels near them.
Red lines represent channels or trend lines, depicting the current market trend and indicating the preferable trading direction.
The MACD(14,22,3) indicator, encompassing both the histogram and signal line, acts as an auxiliary tool and can also be used as a signal source.
Significant speeches and reports (always noted in the news calendar) can profoundly influence the price dynamics. Hence, trading during their release calls for heightened caution. It may be reasonable to exit the market to prevent abrupt price reversals against the prevailing trend.
Beginning traders should always remember that not every trade will yield profit. Establishing a clear strategy coupled with sound money management is the cornerstone of sustained trading success.
¡Los informes analíticos de InstaForex lo mantendrá bien informado de las tendencias del mercado! Al ser un cliente de InstaForex, se le proporciona una gran cantidad de servicios gratuitos para una operación eficiente.

