 Permanecer
Condiciones de negociación
Products
Herramientas


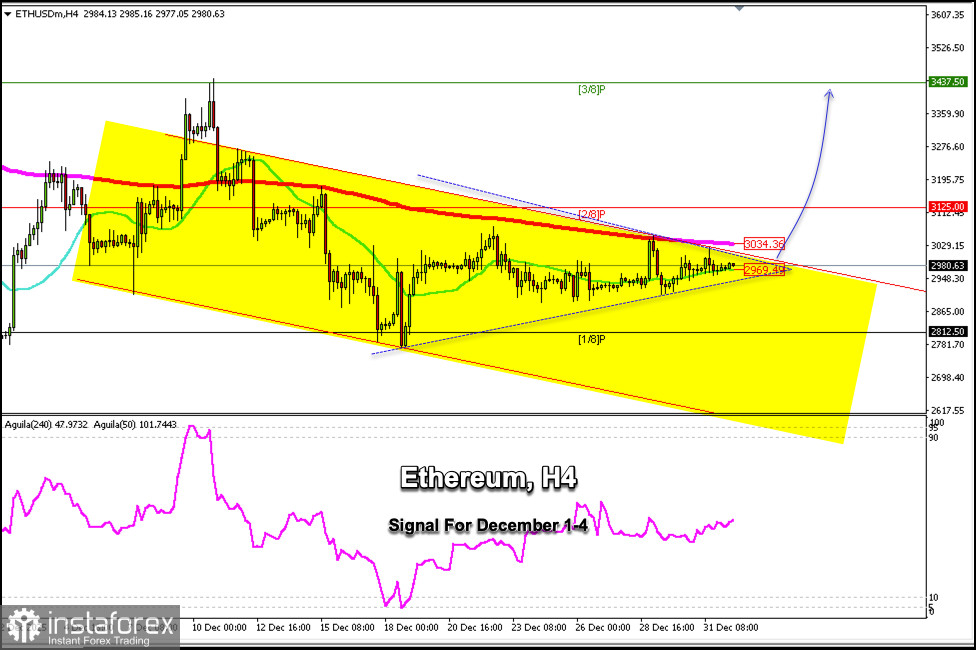
Ethereum is trading around $2,980 above the 21 SMA and within a downtrend channel formed since early December. On the H4 chart, we can see a consolidation of Ether, and a sharp break above the 200 EMA around $3,034 is likely to occur.
On the H4 chart, we can see the formation of a symmetrical triangle. Therefore, if ETH/USD consolidates above the psychological level of $3,000 in the coming days, we could expect it to reach the 3/8 of the Murray level at $3,437.
Conversely, if ETH/USD falls below the symmetrical triangle pattern, we could expect a drop towards the 1/8 Murray at $2,875. Finally, the instrument could reach the bottom of the downtrend channel around $2,590.
The Eagle indicator is showing positive signals, so we should expect confirmation above $3,000 to buy or below $2,930 to sell.
Our outlook remains negative, so we will look for opportunities to sell if Ether falls below $2,950.
¡Los informes analíticos de InstaForex lo mantendrá bien informado de las tendencias del mercado! Al ser un cliente de InstaForex, se le proporciona una gran cantidad de servicios gratuitos para una operación eficiente.


