 Permanecer
Condiciones de negociación
Products
Herramientas


On Friday, the EUR/USD currency pair continued its downward trend, but there is still a glimmer of hope for the euro. A key takeaway from Friday's movement is that the pair did not breach its previous local low. Despite disappointing macroeconomic data for the eurozone and strong reports from the U.S., the quotes failed to decline below their prior low, providing a slight chance for the euro to recover.
As we have mentioned multiple times, the best the euro can hope for is a correction. While this correction could be significant, it would still be just that—a correction. The euro's downtrend has been ongoing for 16 years. On Friday, two critical U.S. reports—the unemployment rate and Non-Farm Payrolls—exceeded expectations, leading to another wave of dollar strengthening. Given the current fundamental and macroeconomic landscape, we anticipate that the dollar's growth will continue.
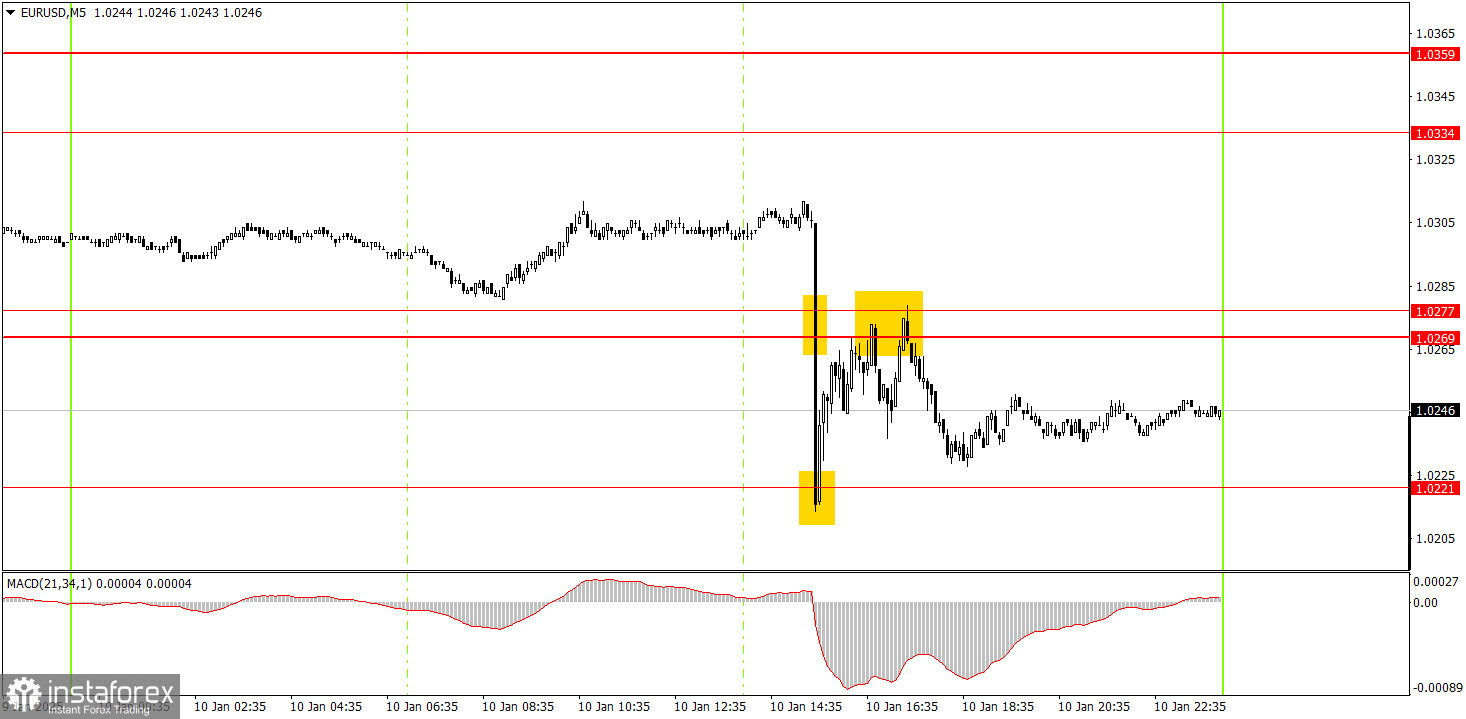
On the 5-minute timeframe, several signals emerged on Friday, but they were difficult to act upon. The movement began following the release of U.S. macroeconomic data. As the key reports showed strong results, the pair dropped 90 pips in just five minutes. Although a recovery followed, entering buy trades in such a macroeconomic environment was highly risky. We believe traders could have successfully taken advantage of a bounce from the 1.0269–1.0277 area, which could have yielded several dozen pips in profit.
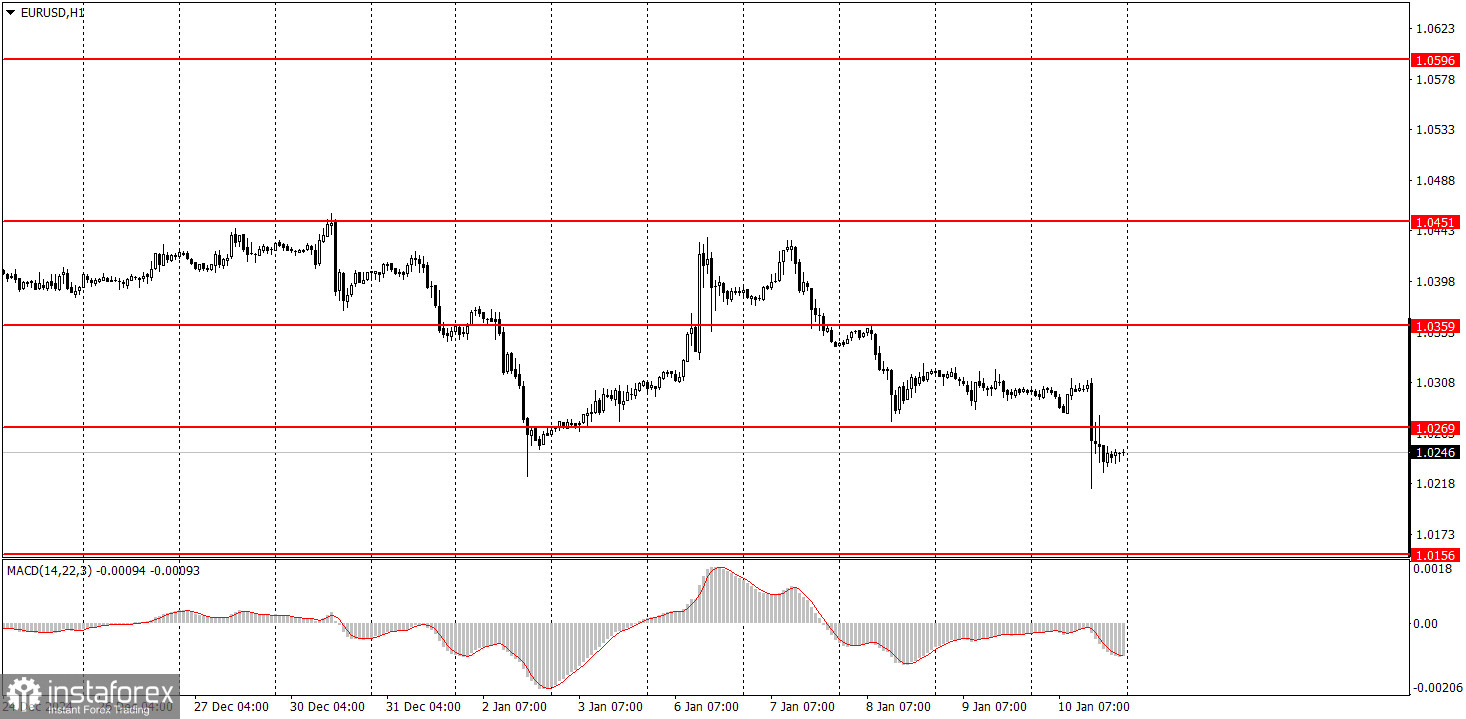
On the hourly timeframe, EUR/USD is currently in a downtrend. We believe that the euro's decline has resumed in the medium term, and parity is now within close reach. As previously stated, we expect the euro to continue falling due to the fundamental and macroeconomic factors that continue to favor the U.S. dollar.
Movements on Monday may be subdued; however, it's important to remember that the overall downtrend, including the local three-month trend, is still ongoing. The market is selling the pair not only in response to U.S. labor market and unemployment data.
On the 5-minute timeframe, consider the following levels: 1.0156, 1.0221, 1.0269–1.0277, 1.0334–1.0359, 1.0433–1.0451, 1.0526, 1.0596, 1.0678, 1.0726–1.0733, 1.0797–1.0804, and 1.0845–1.0851. There are no significant events or reports scheduled in the Eurozone or the U.S. on Monday, which could result in low volatility and may lead the pair towards sideways movement.
Support and Resistance Levels: These are target levels for opening or closing positions and can also serve as points for placing Take Profit orders.
Red Lines: Channels or trendlines indicating the current trend and the preferred direction for trading.
MACD Indicator (14,22,3): A histogram and signal line used as a supplementary source of trading signals.
Important Events and Reports: Found in the economic calendar, these can heavily influence price movements. Exercise caution or exit the market during their release to avoid sharp reversals.
Forex trading beginners should remember that not every trade will be profitable. Developing a clear strategy and practicing proper money management are essential for long-term trading success.
¡Los informes analíticos de InstaForex lo mantendrá bien informado de las tendencias del mercado! Al ser un cliente de InstaForex, se le proporciona una gran cantidad de servicios gratuitos para una operación eficiente.


