 Permanecer
Condiciones de negociación
Products
Herramientas


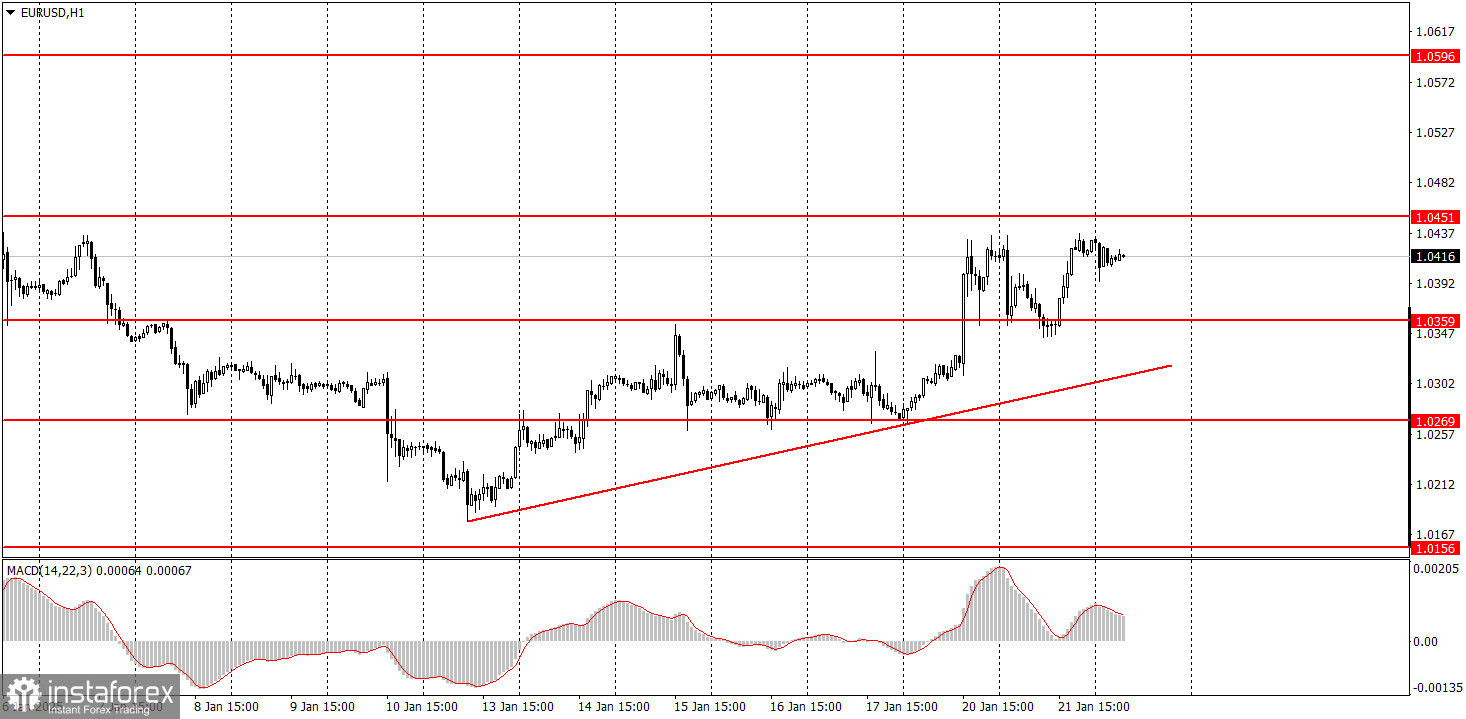
On Tuesday, the EUR/USD currency pair experienced significant movement in both directions. In the first half of the day, there was a noticeable decline, followed by a strong rise in the second half. There were no specific macroeconomic reasons for either the decline or the rise. Donald Trump continues to make bold statements; however, as previously mentioned, the market is likely to soon adapt to the reality that the U.S. President makes numerous declarations daily, most of which lack real-world significance. Therefore, we believe the market will stabilize and cease responding to Trump's proclamations. Currently, an upward correction is underway, supported by a trendline. Traders can use this trendline to help identify the end of the current correction. It is important to note that the broader trend remains bearish.
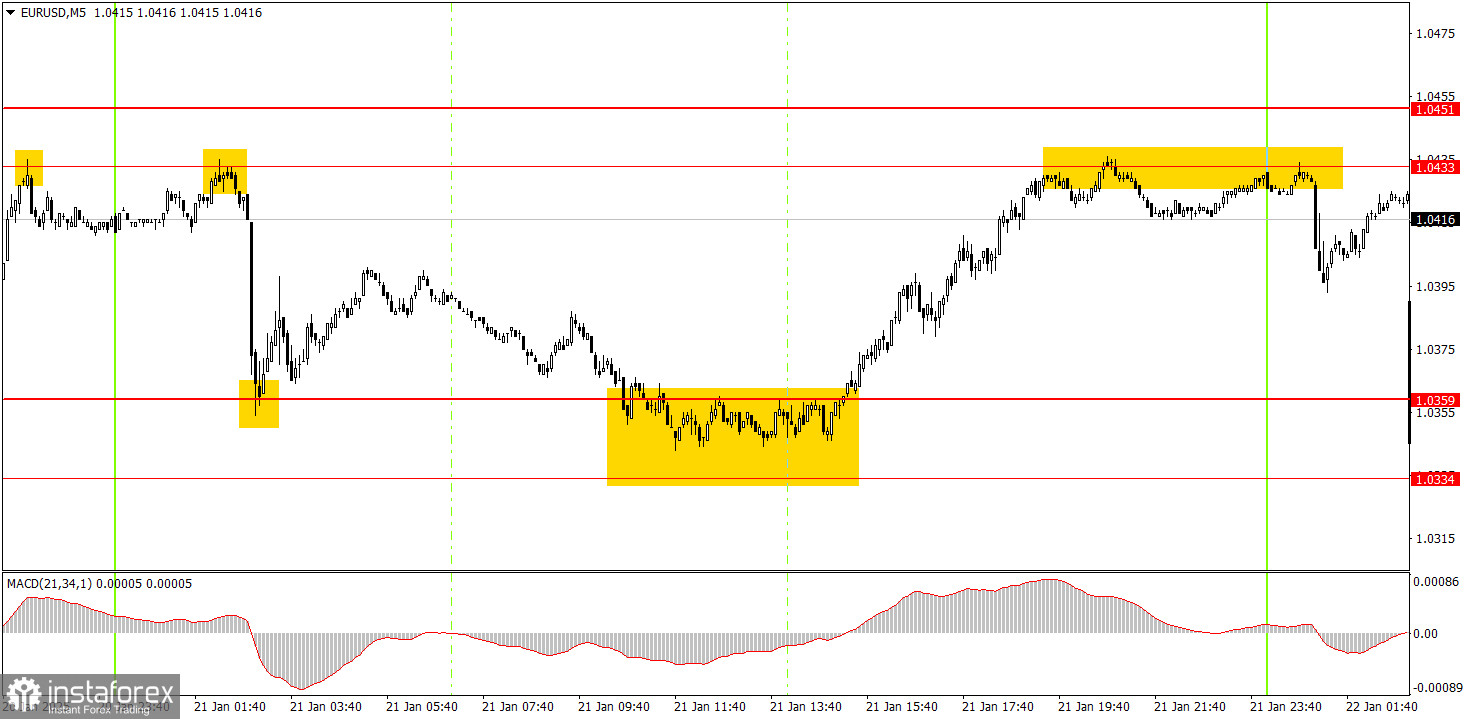
On the 5-minute timeframe on Tuesday, several excellent trading signals emerged. First, the price rebounded from the 1.0359 level, then from the 1.0334-1.0359 zone, eventually reaching the 1.0433 level. While the first signal likely did not yield profits for novice traders, it also didn't result in losses; however, it did occur overnight. The second signal generated a profit of around 50-60 pips. A short position could have been initiated based on the rebound from the 1.0334-1.0359 area, but this signal also emerged mostly overnight.
On the hourly timeframe, the EUR/USD pair is in a broader bearish trend, but the short-term trend is upward. We expect the euro's decline to resume in the medium term, with the pair approaching parity. The current economic and macroeconomic conditions continue to favor the U.S. dollar. This upward correction is supported by a trendline, and breaking below this trendline will indicate the end of the correction.
Movements on Wednesday may be significantly weaker compared to Monday and Tuesday, as the dollar could attempt to recover some of its losses. The trendline will serve as a key point of reference for traders.
On the 5-minute timeframe, the following levels should be considered: 1.0156, 1.0221, 1.0269-1.0277, 1.0334-1.0359, 1.0433-1.0451, 1.0526, 1.0596, 1.0678, 1.0726-1.0733, 1.0797-1.0804, and 1.0845-1.0851. Christine Lagarde is scheduled to give a speech in the European Union on Wednesday; however, it is unlikely to draw significant market attention under the current circumstances. Additionally, there are no scheduled events in America for that day.
Support and Resistance Levels: These are target levels for opening or closing positions and can also serve as points for placing Take Profit orders.
Red Lines: Channels or trendlines indicating the current trend and the preferred direction for trading.
MACD Indicator (14,22,3): A histogram and signal line used as a supplementary source of trading signals.
Important speeches and reports, which are consistently featured in the news calendar, can significantly influence the movement of a currency pair. Therefore, during their release, it is advisable to trade with caution or consider exiting the market to avoid potential sharp price reversals against the prior trend.
Beginners in the Forex market should understand that not every transaction will be profitable. Developing a clear trading strategy and practicing effective money management are crucial for achieving long-term success in trading.
¡Los informes analíticos de InstaForex lo mantendrá bien informado de las tendencias del mercado! Al ser un cliente de InstaForex, se le proporciona una gran cantidad de servicios gratuitos para una operación eficiente.


