 Permanecer
Condiciones de negociación
Products
Herramientas


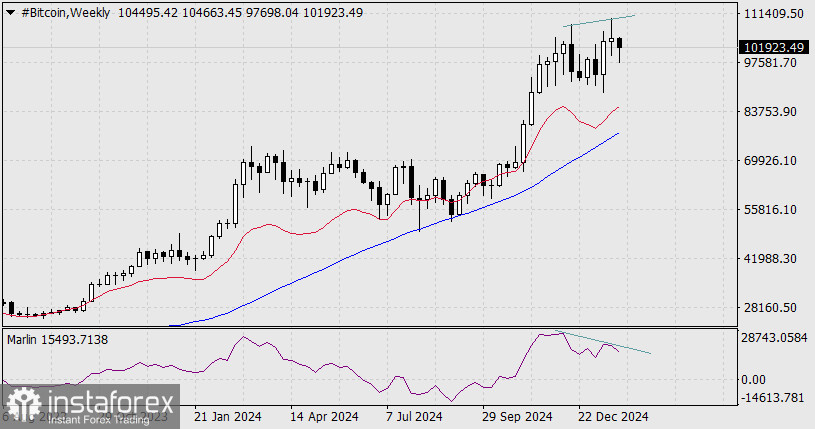
On the weekly chart, there is a clear divergence between the price and the Marlin oscillator. This divergence has significant potential; if it does not lead to a full reversal, it could at least result in a correction lasting 2 to 3 weeks.
On the daily chart, the price has consolidated below the MACD line, and the Marlin oscillator is attempting to enter the downtrend territory. The projected targets for the decline are as follows: 97,698, 96,236, 93,606–94,106, and 90,873, which is the low from November 26.
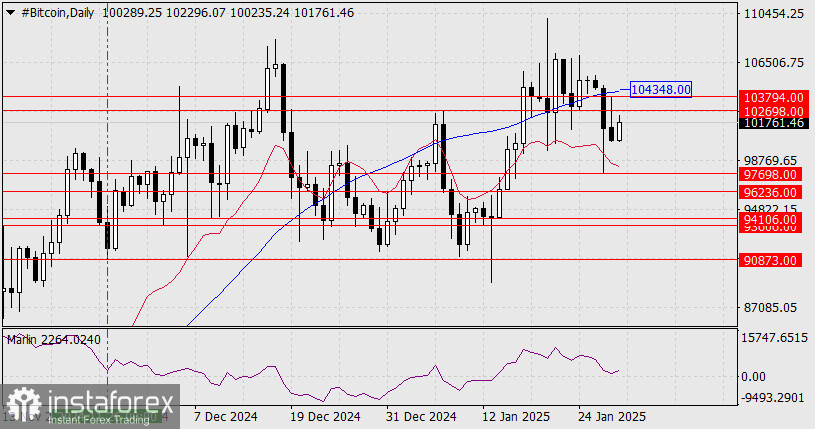
An upward movement could occur if the price breaks above the MACD line at around 104,348. On the four-hour chart, the price remains below the balance line (red moving average) and is holding below the 102,698 level, which is the high from January 7. The Marlin oscillator has solidified its position in the bearish zone.
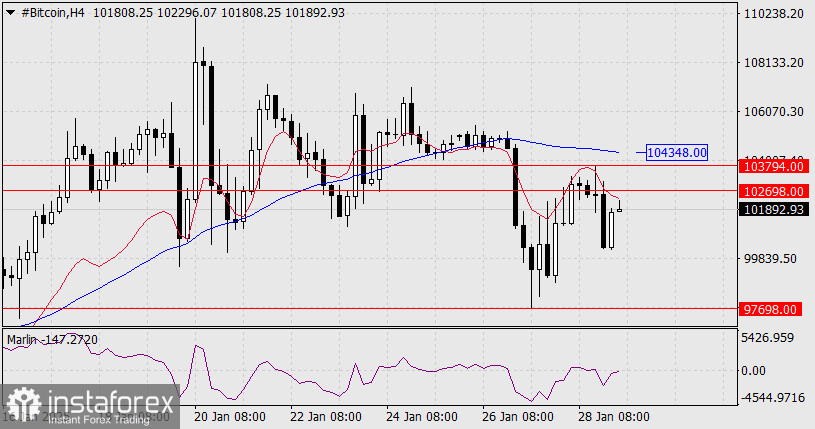
The nearest targets for a decline in Bitcoin are 97,698 and 96,236. Conversely, an alternative upward scenario could develop if the price breaks above 103,794 and the MACD line at 104,348. It is worth noting that the MACD lines on the H4 and daily charts coincide, which further strengthens this resistance level.
¡Los informes analíticos de InstaForex lo mantendrá bien informado de las tendencias del mercado! Al ser un cliente de InstaForex, se le proporciona una gran cantidad de servicios gratuitos para una operación eficiente.


