 Permanecer
Condiciones de negociación
Products
Herramientas


On Monday, the EUR/USD pair began a new upward movement, despite the absence of local fundamental reasons. The only scheduled event for the day was Jerome Powell's speech in the U.S. Congress, which was set to occur in the evening. Nonetheless, throughout the day, the euro continued to rise steadily.
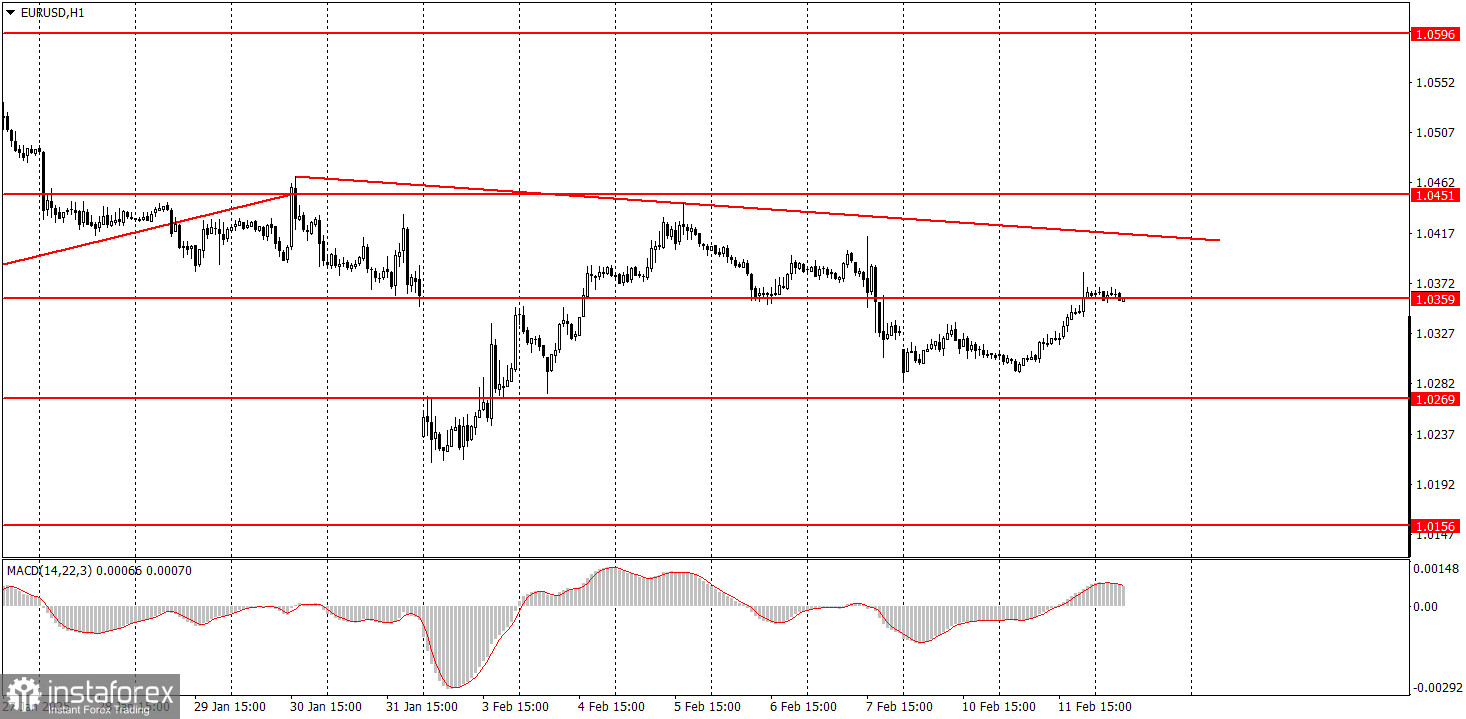
Volatility remained low, and the overall price movement appeared disorganized. On higher timeframes, it is clear that the pair is mainly trading sideways, though there is no clearly defined range at this time.
Such movements are not surprising. We mentioned weeks ago that a correction was needed on the daily timeframe, and corrections often have a complex price structure, making short-term movements difficult to interpret. It's also important to note that price movements in the forex market do not always require fundamental or macroeconomic catalysts. Therefore, while Monday's movement may not have been entirely logical, it also wasn't completely unreasonable.
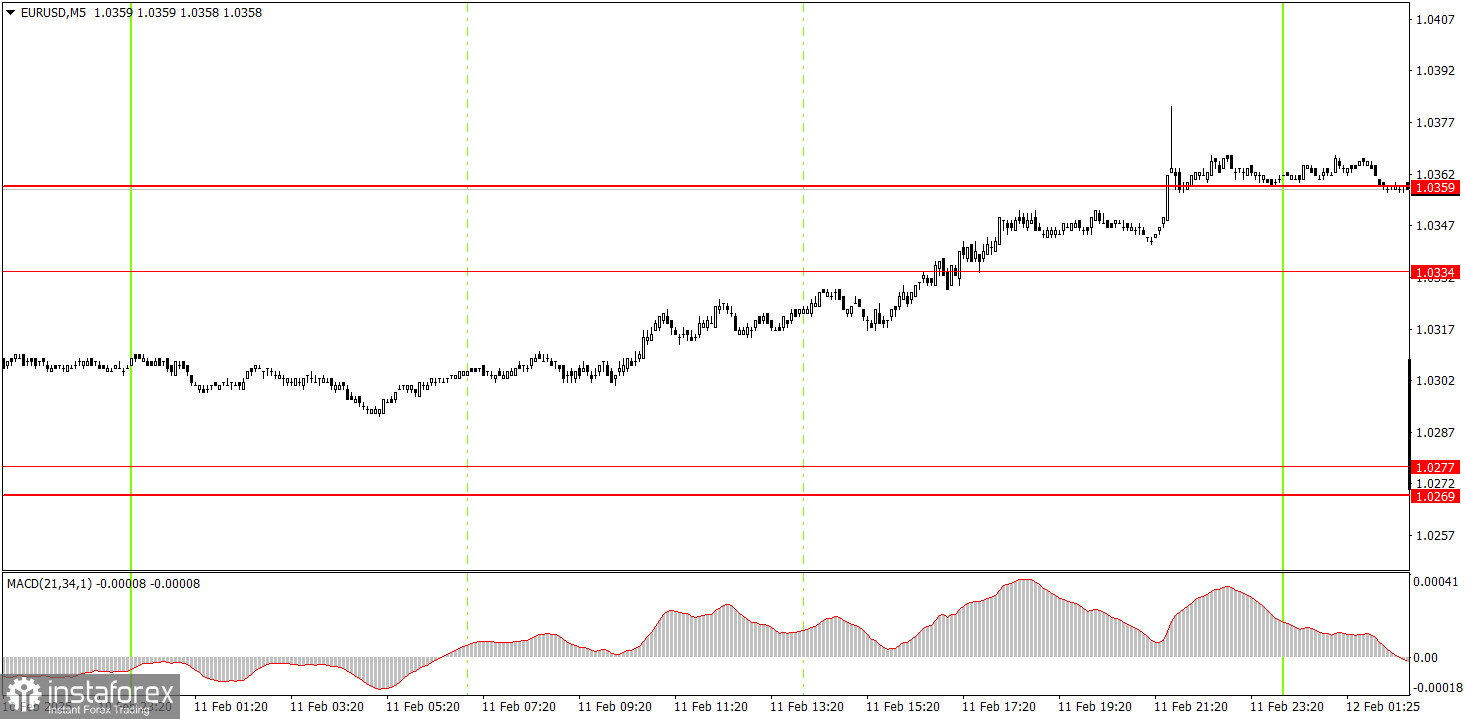
On the 5-minute timeframe, no valid trading signals were generated on Tuesday. Only late in the U.S. session (overnight) did the pair consolidate above the 1.0334–1.0359 range. However, it is unlikely that traders opened positions during the night, and the breakout was weak and unconvincing. As a result, we doubt that the euro's upward movement will continue today.
On the hourly timeframe, EUR/USD is currently in a medium-term downtrend. Although the local uptrend was interrupted, it has since resumed. We anticipate that the euro will continue to decline, as the fundamental and macroeconomic factors still favor the U.S. dollar. However, the daily correction could last for several more weeks.
On Wednesday, price movements may be volatile and unpredictable as the corrective phase continues. It is advisable to base trading decisions on key technical levels.
For the 5-minute timeframe, the key levels to monitor are: 1.0156, 1.0221, 1.0269–1.0277, 1.0334–1.0359, 1.0433–1.0451, 1.0526, 1.0596, 1.0678, 1.0726–1.0733, 1.0797–1.0804, and 1.0845–1.0851. On Wednesday, Jerome Powell will give his second speech in Congress. In his previous appearance before the Senate Banking Committee, he did not provide any new information, and it is unlikely that today's remarks will yield significant insights either. However, the U.S. inflation report (CPI) will be released today, which is a crucial macroeconomic event.
Support and Resistance Levels: These are target levels for opening or closing positions and can also serve as points for placing Take Profit orders.
Red Lines: Channels or trendlines indicating the current trend and the preferred direction for trading.
MACD Indicator (14,22,3): A histogram and signal line used as a supplementary source of trading signals.
Important Events and Reports: Found in the economic calendar, these can heavily influence price movements. Exercise caution or exit the market during their release to avoid sharp reversals.
Forex trading beginners should remember that not every trade will be profitable. Developing a clear strategy and practicing proper money management are essential for long-term trading success.
¡Los informes analíticos de InstaForex lo mantendrá bien informado de las tendencias del mercado! Al ser un cliente de InstaForex, se le proporciona una gran cantidad de servicios gratuitos para una operación eficiente.


