 Permanecer
Condiciones de negociación
Products
Herramientas


On Friday, the EUR/USD currency pair exhibited sluggish movement, as if it were doing someone a favor. The macroeconomic background was notably strong but also contradictory. Despite this, traders remained active in the market. A significant number of business activity indices and other less important reports were released. For example, in Europe, manufacturing sectors in Germany and the Eurozone performed better than expected, while the services sectors underperformed.
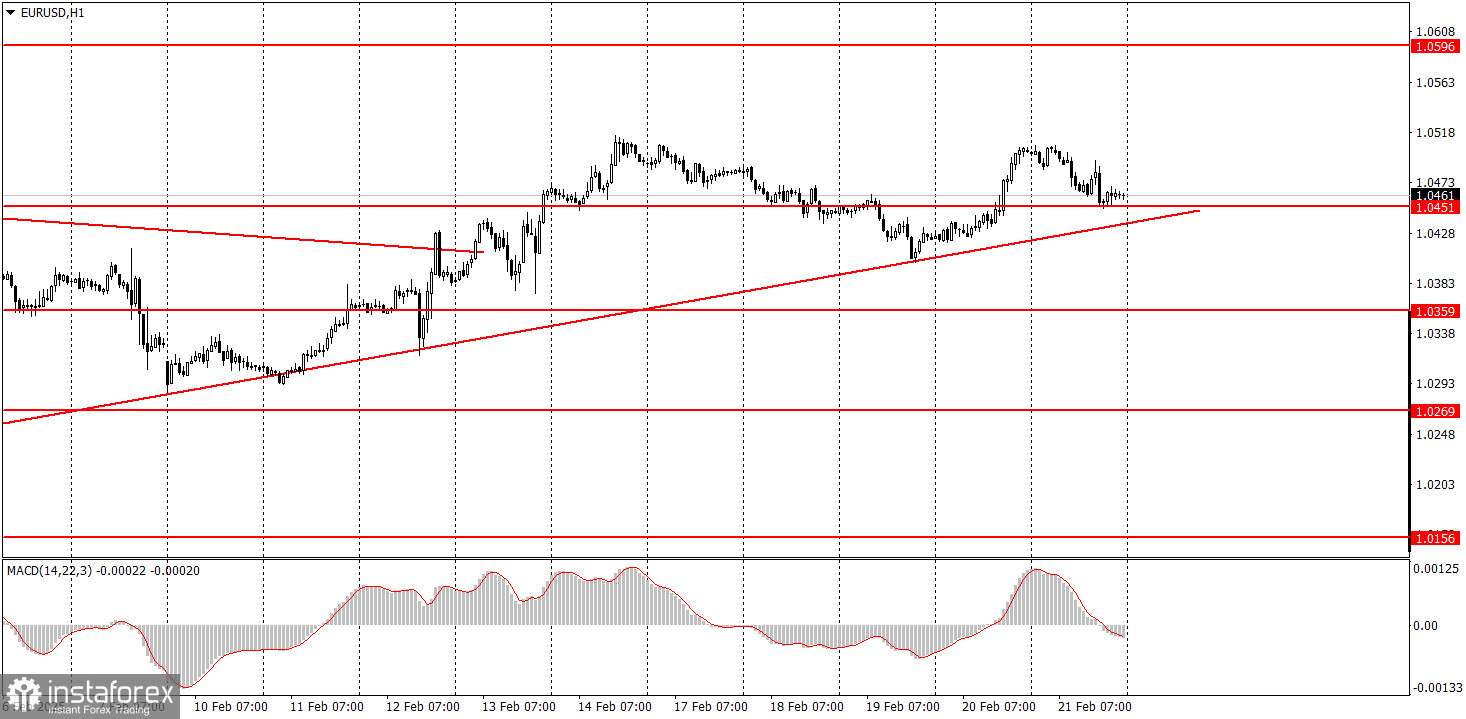
How should the market have reacted to these mixed signals? In the US, the manufacturing PMI increased, while the services PMI fell below the 50.0 level. By the end of the day, the euro experienced a slight decline but remained above the trendline. We believe a breakthrough of this trendline is imminent, likely leading to a new short-term downward trend.
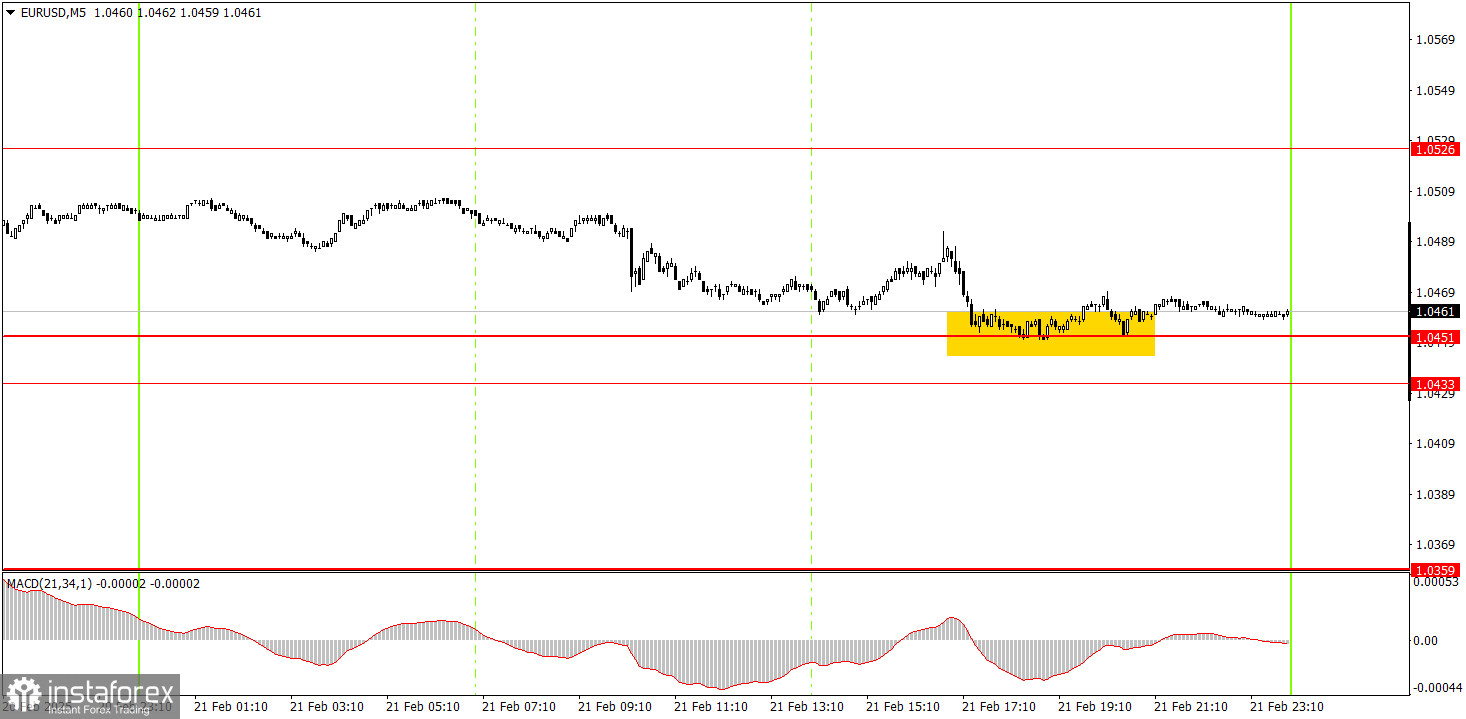
On the 5-minute chart, only one trading signal was generated on Friday. Throughout the past week, there were very few signals due to low volatility. The solitary signal on Friday occurred near market close, where the price dropped to the 1.0451 level but did not bounce back and rise. Ultimately, opening positions at market close was not the most sensible option.
In the hourly timeframe, the EUR/USD pair continues to show a medium-term downward trend and a local upward trend. As before, a decline in the euro should be expected, as the fundamental and macroeconomic background continues to support the US dollar much more than the euro. However, the upward correction on the daily timeframe may persist for several weeks. We may see a few more trends on the hourly timeframe before the prominent decline resumes.
On Monday, the pair's movements may once again be very weak. Even breaking the trendline may not affect volatility, and there will again be very few news releases.
On the 5-minute timeframe, key levels to watch are 1.0156, 1.0221, 1.0269-1.0277, 1.0334-1.0359, 1.0433-1.0451, 1.0526, 1.0596, 1.0678, 1.0726-1.0733, 1.0797-1.0804, and 1.0845-1.0851. On Monday, there is nothing significant in the macroeconomic background. The Consumer Price Index stands out, but it will only be the second estimate for January, which is unlikely to differ from the initial estimate. Most likely, we are in for another "boring Monday."
Support and Resistance Levels: These are target levels for opening or closing positions and can also serve as points for placing Take Profit orders.
Red Lines: Channels or trendlines indicating the current trend and the preferred direction for trading.
MACD Indicator (14,22,3): A histogram and signal line used as a supplementary source of trading signals.
Important Events and Reports: Found in the economic calendar, these can heavily influence price movements. Exercise caution or exit the market during their release to avoid sharp reversals.
Forex trading beginners should remember that not every trade will be profitable. Developing a clear strategy and practicing proper money management are essential for long-term trading success.
¡Los informes analíticos de InstaForex lo mantendrá bien informado de las tendencias del mercado! Al ser un cliente de InstaForex, se le proporciona una gran cantidad de servicios gratuitos para una operación eficiente.


