 Permanecer
Condiciones de negociación
Products
Herramientas


In my morning forecast, I focused on the 1.0404 level and planned to base my trading decisions on it. Let's analyze the 5-minute chart to see what happened. A decline and false breakout at this level provided a long entry opportunity, resulting in a rise of over 40 points. The technical outlook for the second half of the day has been revised.
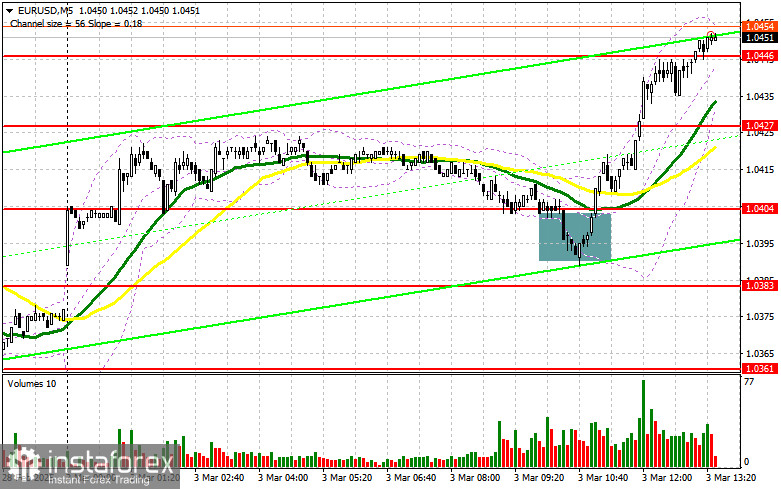
To Open Long Positions on EUR/USD:
Manufacturing activity in the eurozone continues to recover, and February's data showed that the pace of contraction has slowed compared to previous months. This supported the euro, triggering another wave of growth against the U.S. dollar.
In the second half of the day, attention will be on the ISM Manufacturing Index in the U.S. for February and construction spending data. Strong figures may limit EUR/USD's upward potential. Given the bullish market, I plan to buy on dips.
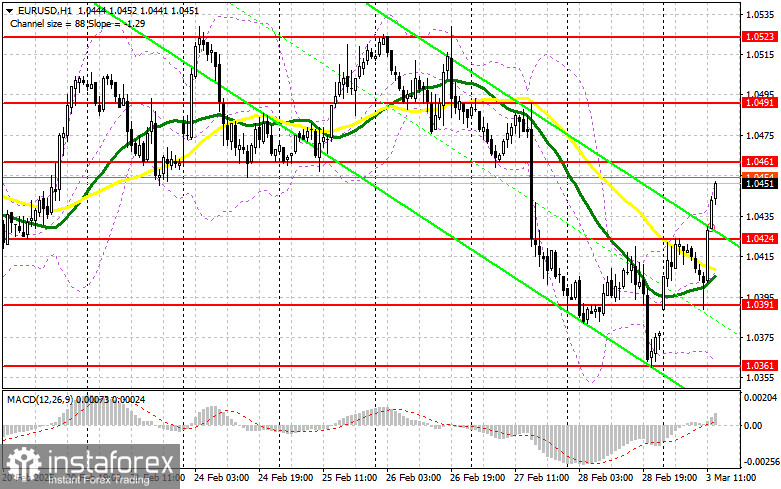
A false breakout at the 1.0424 support level would provide an ideal buy signal, targeting 1.0461, which formed as resistance last week. A breakout and retest of this range from above would confirm a long entry, pushing the pair toward 1.0491. The final target is the 1.0523 high, where I plan to lock in profits.
If EUR/USD declines and there is no buying activity at 1.0424, euro demand will drop further, allowing sellers to push the price down to 1.0391 – a new support level. I will consider long positions only after a false breakout at this level. I plan to buy on an immediate rebound from 1.0361, targeting an intraday correction of 30-35 points.
To Open Short Positions on EUR/USD:
Sellers have been relatively inactive, focusing on defending resistance at 1.0461, which is likely to be tested soon. A false breakout at this level will signal a short entry, targeting support at 1.0424.
A break below 1.0424 (which is only likely with strong U.S. manufacturing data) and retest from below would confirm another selling opportunity, with 1.0391 as the next target. The final bearish target is 1.0361, where I plan to take profits.
If EUR/USD rises further in the second half of the day and sellers fail to act at 1.0461, buyers may push for stronger gains. In this case, I will postpone short positions until a test of 1.0491. I will sell only after a failed consolidation above this level. If there is no downward movement there either, I will look for short entries at 1.0523, expecting a 30-35 point correction.
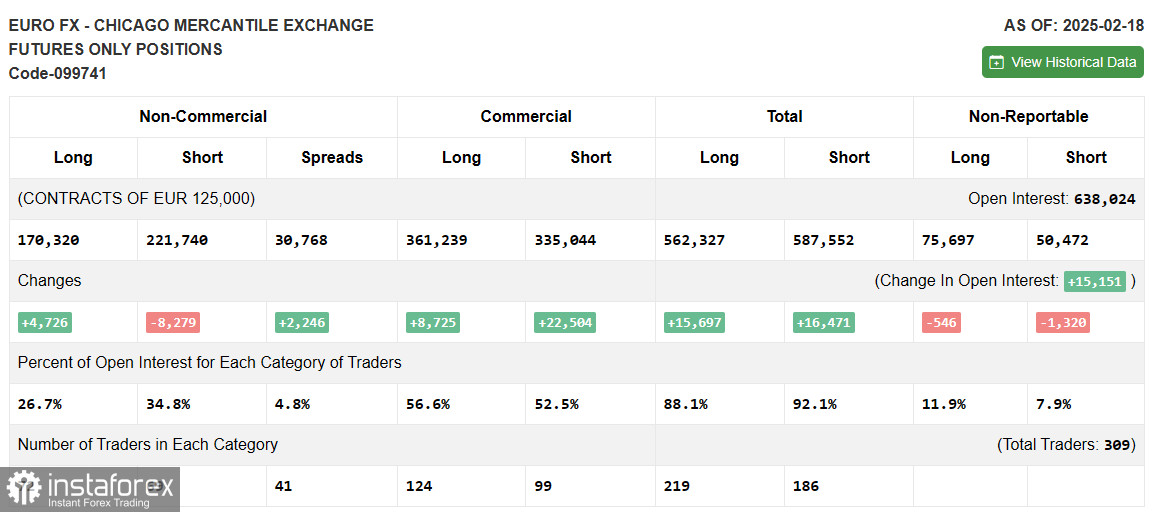
COT (Commitment of Traders) Report Analysis
The COT report from February 18 showed an increase in long positions and a sharp reduction in shorts. Interest in buying euros has risen, driven by talks between the U.S. and Russia regarding the Ukraine conflict. The potential for de-escalation has boosted demand for risk assets, helping the euro.
However, sellers still maintain an advantage, so caution is needed when buying at highs. The COT report revealed that non-commercial long positions increased by 4,726, reaching 170,320, while short positions dropped by 8,279, totaling 221,740. As a result, the net short position has declined by 2,246.
Indicator Signals
The pair is trading above the 30 and 50-period moving averages, signaling a return of buyers to the market.
Note: The moving averages referenced are based on the H1 chart, differing from traditional daily moving averages (D1).
If the pair declines, the lower Bollinger Band at 1.0361 will act as support.
Indicator Descriptions:
¡Los informes analíticos de InstaForex lo mantendrá bien informado de las tendencias del mercado! Al ser un cliente de InstaForex, se le proporciona una gran cantidad de servicios gratuitos para una operación eficiente.


