 Permanecer
Condiciones de negociación
Products
Herramientas


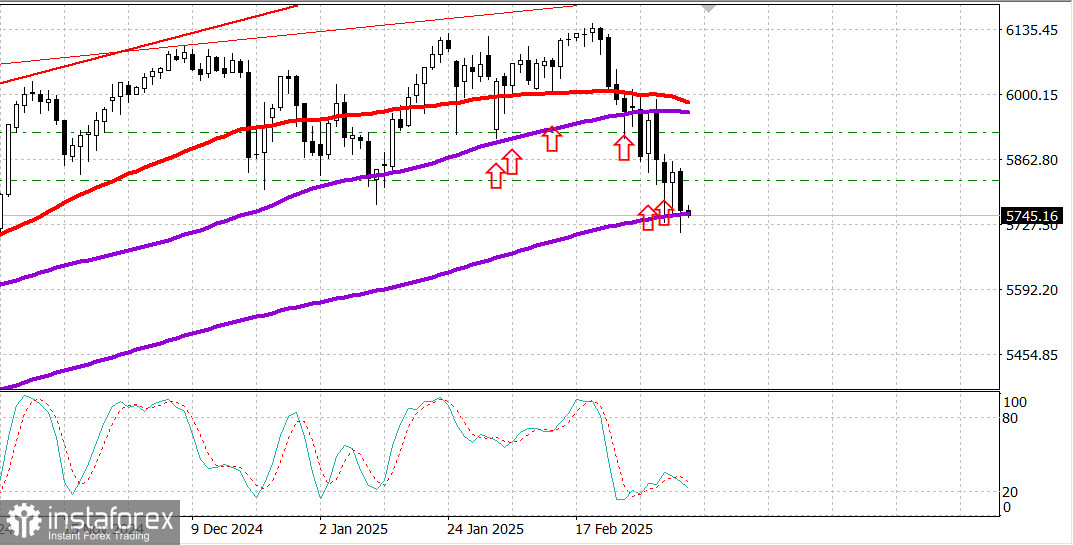
S&P500
Market review on March 7
Snapshot of benchmark US stock indices on Thursday
Dow Jones: -1.0%
NASDAQ: -2.6%
S&P 500: -1.8%
S&P 500: 5,738, range: 5,650 – 6,200
The stock market took another nosedive on Thursday after a brief pause on Wednesday.
As in previous sessions, the rhetoric of the White House regarding US trade policy negatively impacted the stock market.
The S&P 500 briefly fell below its 200-day moving average at 5,730, hitting a session low of 5,711 before closing just above this key technical level. However, the Nasdaq Composite (-2.6%) and Russell 2000 (-1.6%) dropped well below their respective 200-day moving averages.
Nasdaq in correction territory
The Nasdaq Composite closed on Thursday with a 10.4% plunge from its all-time high on December 16, officially putting the index in correction territory.
The S&P 500 is now 6.6% below its all-time high after Thursday's broad sell-off.
Trade policy & market reaction
The market attempted a brief recovery in the mid-morning session after Commerce Secretary Lutnick told CNBC that all goods and services compliant with USMCA would be exempt from new tariffs for one month. However, the rebound was short-lived, and the market remained in a steady downtrend by the time President Trump signed an order detailing exemptions in the afternoon.
Still, 62% of Canadian goods and 50% of Mexican goods remain subject to tariffs, with tariff exemptions set to expire on April 2.
Mega-cap & semiconductor sell-off
The sell-off in mega-cap stocks and semiconductor companies dealt a blow to the broader market, reflecting the flood of speculative trades.
NVIDIA (NVDA 110.57, -6.73, -5.7%) was a key catalyst for the decline.
Marvell Technology (MRVL 72.28, -17.86, -19.8%) issued disappointing guidance, which contributed to weakness in the semiconductor sector.
Year-to-date market performance:
Dow Jones Industrial Average: +0.1%
S&P 500: -2.4%
S&P Midcap 400: -4.9%
Nasdaq Composite: -6.4%
Russell 2000: -7.3%
Economic calendar on Thursday
Previous figure revised from -$98.4 billion to -$98.1 billion.
Key takeaway: Anticipation of new tariffs led to a surge in imports, which will weigh on Q1 GDP forecasts.
Previous: 242,000
Weekly continuing jobless claims: 1.897 million
Previous revised from 1.862 million to 1.855 million
Key takeaway: The decline in initial jobless claims—a leading indicator—eases concerns about a weakening labor market.
Previous: +1.2%
Previous: +3.0%
Key takeaway: Higher productivity and lower labor costs are positive for market sentiment, as improved productivity offsets inflationary pressures.
Previous revised from -0.5% to -0.4%
Economic calendar on Friday
Energy. Brent crude is now trading at $69.50. Oil remains under pressure due to the sell-off of US stocks.
Forex news
The ECB cut interest rates by 0.25% on Thursday, March 6.
However, despite a sharp rally of EUR/USD to 1.0800 before the decision, the euro gave a muted response to the ECB rate cut.
For smart traders, this is a key signal that EUR/USD is able to maintain bullish momentum.
So, it's a good idea to keep long positions from support levels.
Conclusion:
The US stock market remains under heavy pressure, but economic data remains stable. The ISM services index for February showed stronger-than-expected growth, and weekly jobless claims remain low, signaling a strong labor market. The S&P 500 attempting to hold above its 200-day moving average is a positive sign.
Strategy: maintain buy positions from key support levels—current prices present attractive entry points for long-term investors.
¡Los informes analíticos de InstaForex lo mantendrá bien informado de las tendencias del mercado! Al ser un cliente de InstaForex, se le proporciona una gran cantidad de servicios gratuitos para una operación eficiente.


