 Permanecer
Condiciones de negociación
Products
Herramientas


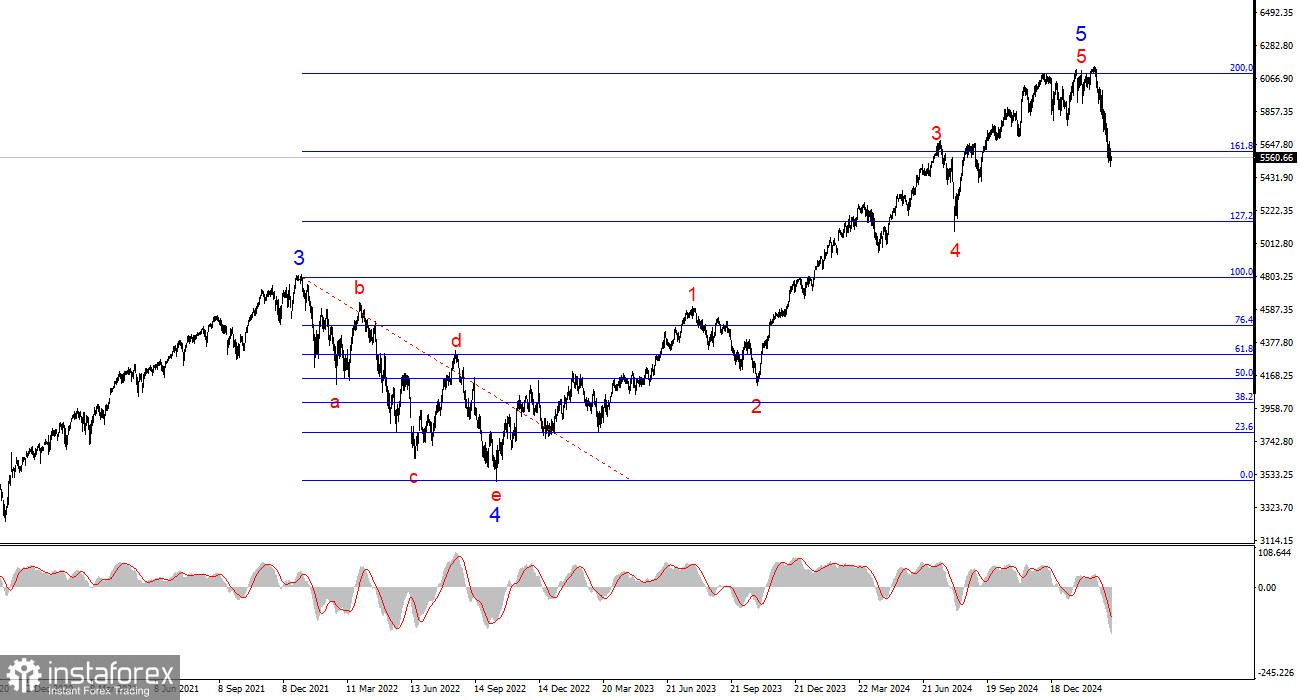
The 24-hour chart wave structure for #SPX appears relatively clear. The first key observation is the global five-wave structure, which is so extensive that it doesn't even fit into the terminal window at the smallest scale. In simple terms, U.S. stock indices have been rising for a very long time. However, we know that trends alternate. At this point, wave 5 within wave 5 appears to have completed. The index made four unsuccessful attempts to break the 6093 level, which corresponds to 200.0% Fibonacci from wave 4. In my view, we are likely to see a corrective wave sequence soon. The U.S. stock market is overheated, and more analysts are starting to discuss the possibility of a bubble.
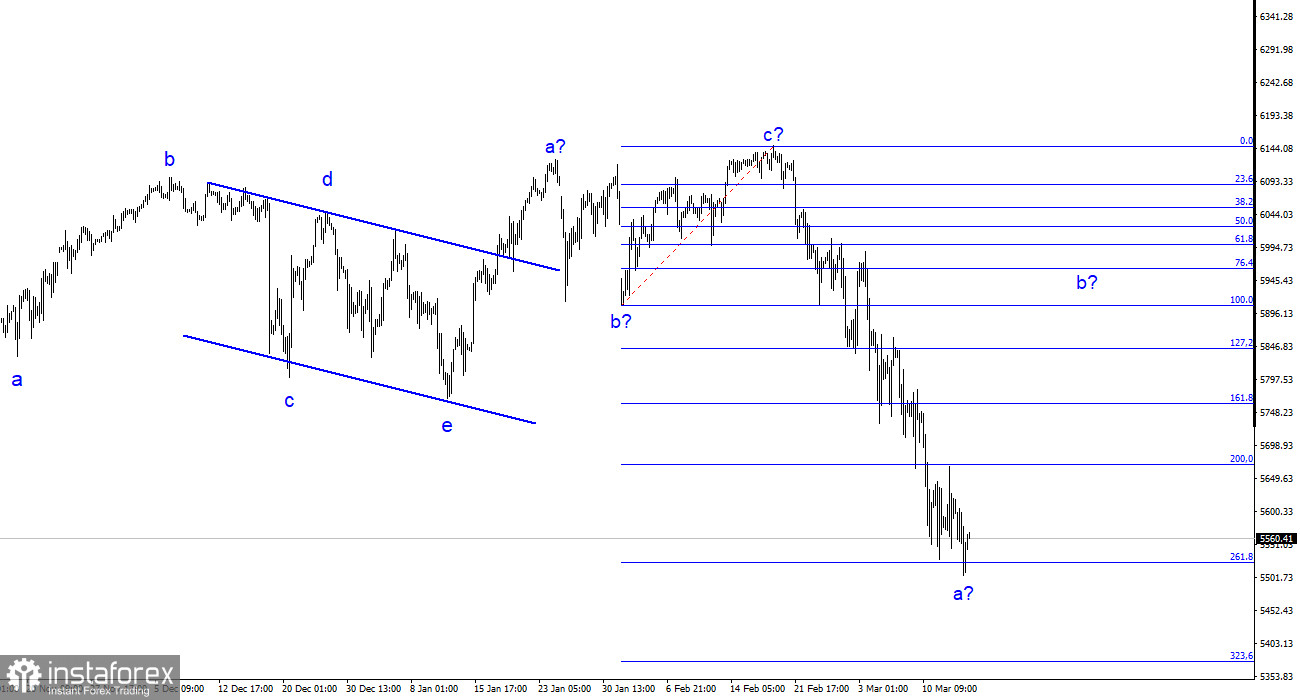
Switching to the 4-hour chart, we can observe a completed complex corrective structure (a-b-c-d-e) and an upward structure resembling an a-b-c pattern. This suggests that a new downward wave has begun forming, with its first wave strongly resembling an impulse. Based on this, I expect an upward wave 2 or b, followed by a renewed decline. At the moment, I would lean on the daily chart's wave structure, which points to a prolonged S&P 500 downturn.
The #SPX index continues to decline, now resembling a Bitcoin-style crash. But is that surprising? The U.S. dollar is also in freefall, and Bitcoin is barely holding on to avoid sinking even lower. The reason behind the chaos in the markets is clear—and it's singular: Donald Trump.
Trump's tariffs could trigger a recession in the U.S. economy, but the U.S. president has no interest in what happens to the stock market. His objectives lie elsewhere—primarily expansionist and protectionist policies. Trump wants to bring manufacturing back to America, secure better trade deals with every country, acquire Greenland, control the Panama Canal, end the war in Ukraine, and weaken China's global standing. The list goes on—but this is Trump's agenda, not America's. Has anyone in the U.S. ever previously advocated for reclaiming the Panama Canal?
Given all of this, Trump is indifferent to how much the economy slows or how much stock indices collapse. Investors recognize this and are redirecting capital into safe-haven assets or economies that are not actively destabilizing their own markets. For this reason, I believe that S&P 500's decline will continue.
Based on my analysis of #SPX, I conclude that the index has completed its upward trend segment. I recommend focusing on the 6125 level and Trump's policies. Trump is implementing measures that threaten the stability of the U.S. economy and corporations (trade wars, tariffs, and import duties), increasing the likelihood of a new bearish trend. The U.S. stock market bubble is stretched to its limit.
The 4-hour chart suggests one more upward wave before a renewed decline, while the 24-hour chart indicates the formation of a longer-term downtrend.
On a higher timeframe, the wave structure becomes even clearer—a distinct five-wave formation, with a five-wave sequence within the fifth wave. This final fifth wave may be nearing completion, implying that traders should prepare for a long and complex correction, which may have already begun.
¡Los informes analíticos de InstaForex lo mantendrá bien informado de las tendencias del mercado! Al ser un cliente de InstaForex, se le proporciona una gran cantidad de servicios gratuitos para una operación eficiente.


