 Permanecer
Condiciones de negociación
Products
Herramientas


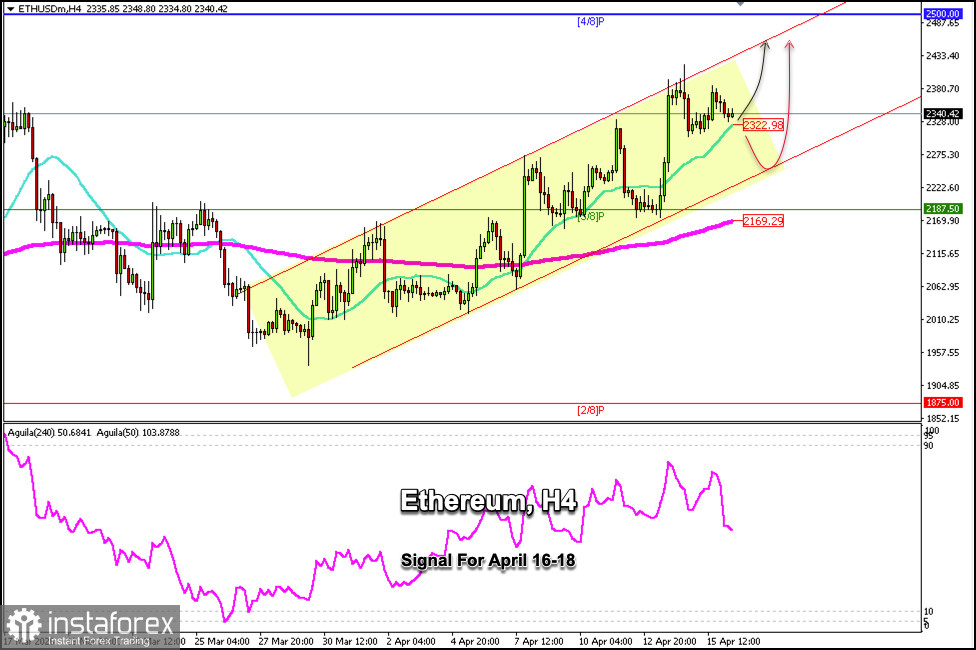
Ethereum (ETH/USD) is trading around $2,340 above the 21-day SMA and showing signs of waning bullish momentum. After three failed attempts to break above the $2,400 level, Ethereum is undergoing a technical correction and could find solid support around $2,300.
If bearish momentum prevails and Ethereum consolidates below the 21 SMA, we could expect it to continue its downtrend and undergo a technical correction until finding support around the lower band of the uptrend channel at $2,220.
A technical rebound around the lower band of the uptrend channel could be seen as an opportunity to open long positions. The price will reach the psychological level of $2,500 around the 4/8 Murray line in the coming days.
Only a decisive break below the bullish trend channel and a consolidation below the 3/8 Murray line—and in turn below the 200 EMA at $2,169—could signal a shift in the ETH/USD trend, potentially entering a bearish phase that could drive prices down toward the 2/8 Murray line at $1,875.
Given that the Eagle indicator is showing overbought signals, we could expect a technical correction toward $2,200 to open long positions. Otherwise, we could look for opportunities to open short positions from current price levels below $2,400.
¡Los informes analíticos de InstaForex lo mantendrá bien informado de las tendencias del mercado! Al ser un cliente de InstaForex, se le proporciona una gran cantidad de servicios gratuitos para una operación eficiente.


