 Permanecer
Condiciones de negociación
Products
Herramientas


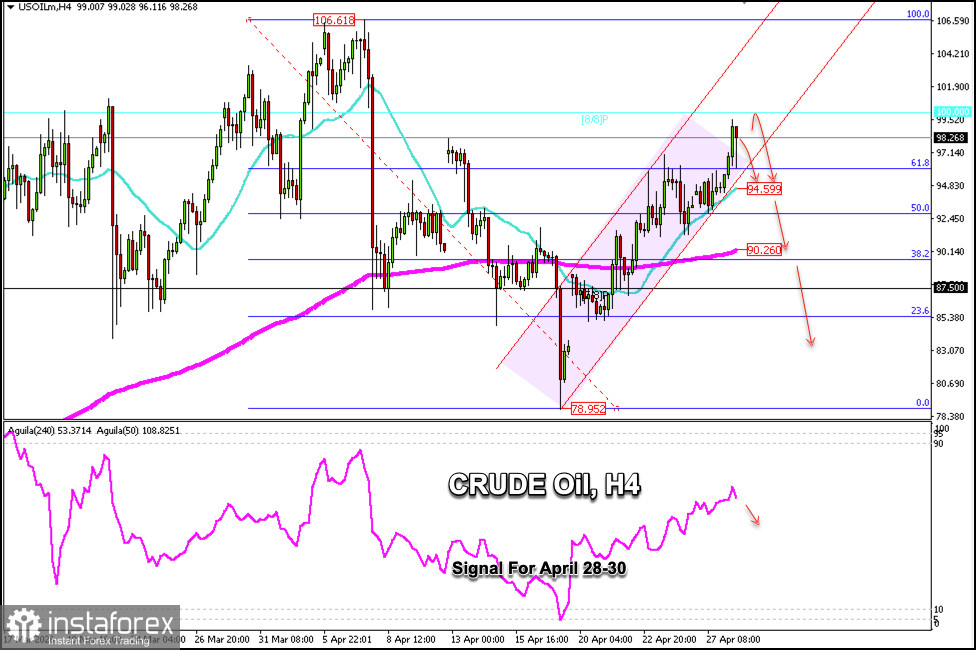
After consolidating above $93 since the start of the week around the 50% Fibonacci level, USD/OIL is gaining strong momentum, reaching the $99.48 per barrel area during the early hours of the European session.
The technical chart shows a correction below $100 toward $96.50, around the 61.8% Fibonacci level. We also see a technical rebound, but crude oil may already be struggling to continue rising, so it would be a good idea to sell.
If crude oil reaches the strong resistance at $100 around the 8/8 Murray line and encounters strong rejection in the coming hours, this could be seen as a signal to open short positions with targets at the 61.8% Fibonacci level around $96.50 and at the 21 SMA around $94.59.
On the H4 chart, we can see the Fibonacci retracement line, which crude oil surpassed at the 61.8% level during the Asian session as it approached $100. If crude oil consolidates below the 61.8% Fibonacci level, this could be seen as a clear signal to sell in the coming days.
The Eagle indicator is giving a negative signal, so we can sell around $99.50 or below this zone with targets at $96 and finally at the 21 SMA.
Crude oil left a gap on April 17, and this gap could be filled if crude oil falls below $95 and breaks decisively out of the uptrend channel; in that case, it could reach the 200-day EMA around $90 and eventually reach $83.
¡Los informes analíticos de InstaForex lo mantendrá bien informado de las tendencias del mercado! Al ser un cliente de InstaForex, se le proporciona una gran cantidad de servicios gratuitos para una operación eficiente.


