 Permanecer
Condiciones de negociación
Products
Herramientas


The GBP/USD pair traded sideways on Friday, unlike the EUR/USD pair. And that's rather strange. For several weeks now, the British pound has been moving in a flat range without clear boundaries. Nonetheless, the sideways movement is clearly visible. The pound is neither falling nor rising. Interestingly, the euro didn't have enough reasons to rise on Friday, while the pound did. UK GDP for the fourth quarter came in slightly above forecasts (on a year-over-year basis), and retail sales exceeded expectations by 1.3%. So, if any currency should have strengthened on Friday, it was the pound. It's also worth noting that the latest tariff package from Donald Trump impacts the European Union much more than the United Kingdom. Moreover, the EU is under threat of the new U.S. tariffs, while London may be able to strike a deal with Trump. Thus, although we've long said that the pound's growth has been illogical, Friday was when it had valid reasons to rise — unlike the euro, which currently holds very few strong cards.
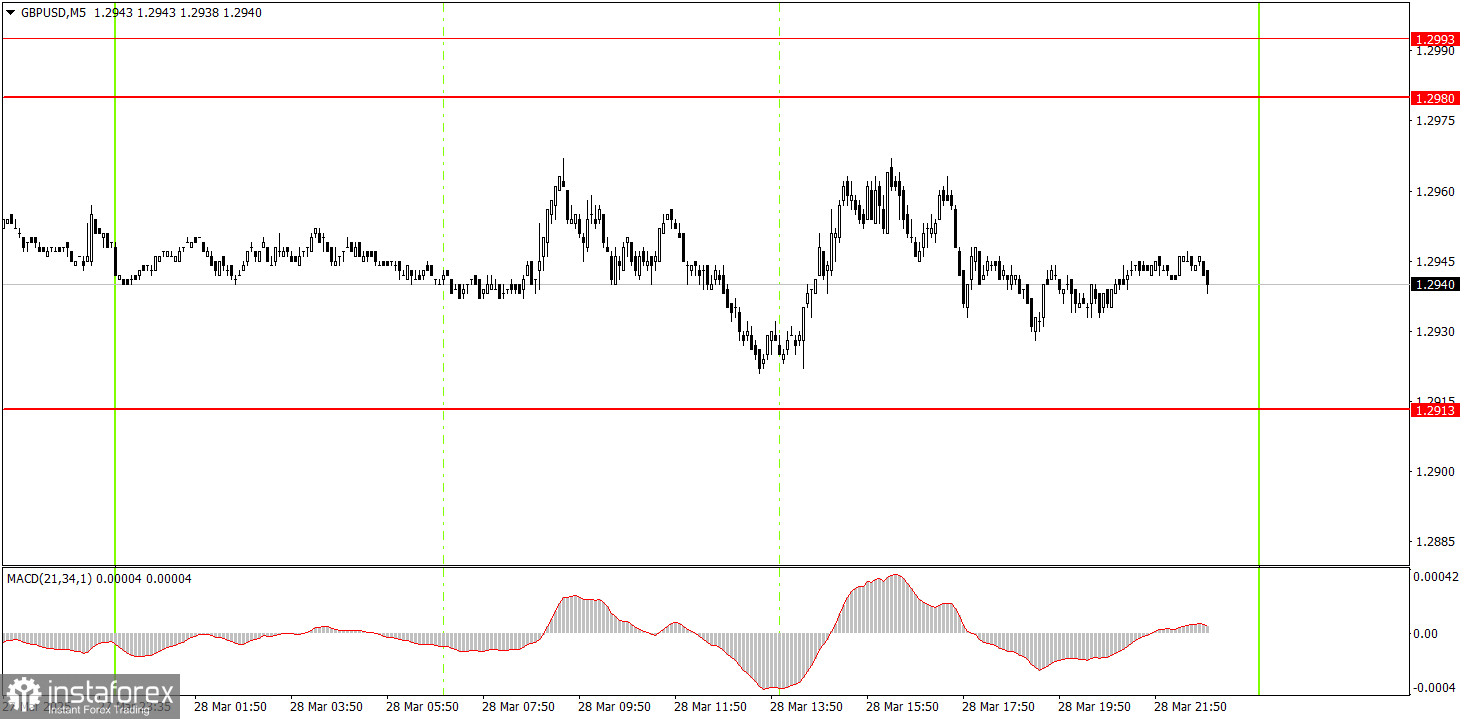
On the 5-minute timeframe, no trading signal was formed on Friday. Recent movements have been erratic and resemble "swings." There are no clear boundaries to the sideways range, so trading on rebounds hasn't worked either. There was no reason to enter the market on Friday.
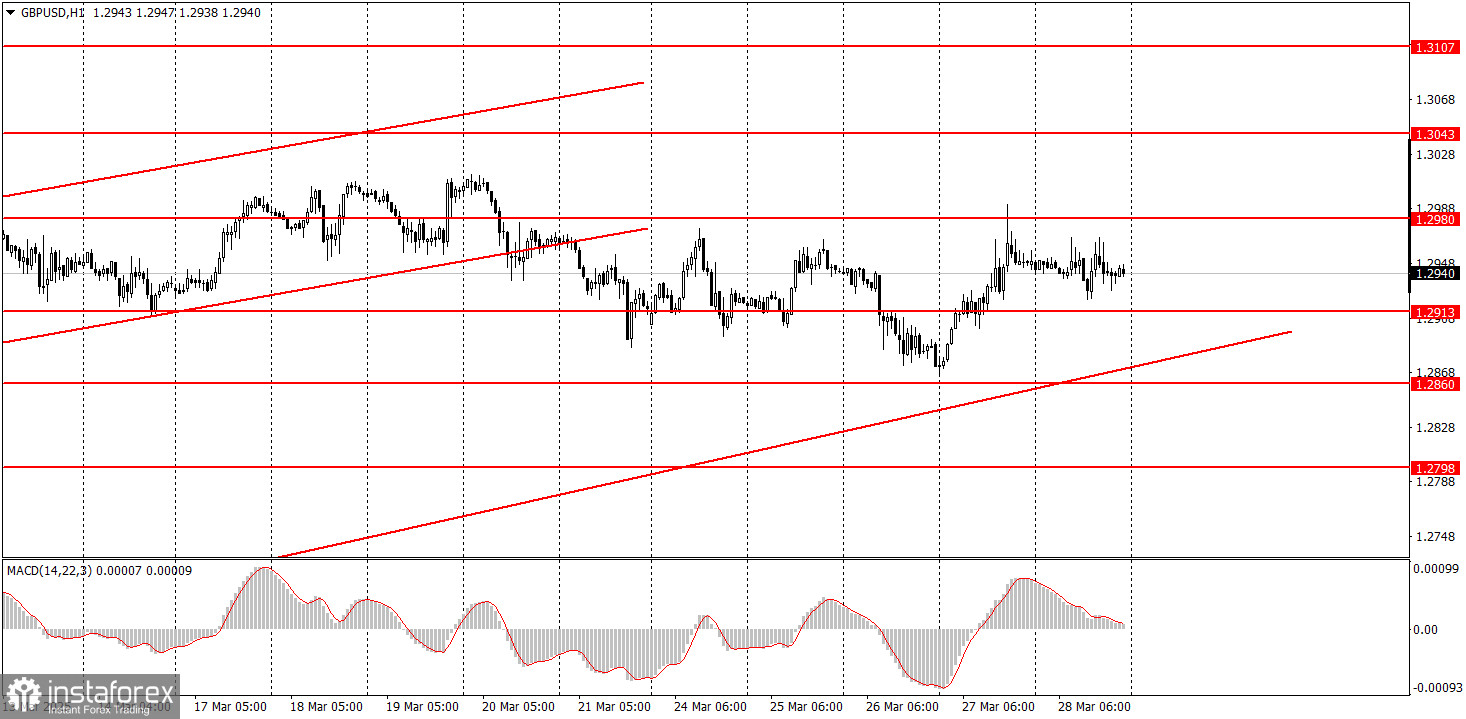
On the hourly timeframe, the GBP/USD pair should have begun a downtrend long ago, but Trump is doing everything to prevent that. We still expect the pound to fall toward the 1.1800 target in the medium term, but it's unclear how long the dollar's "Trump-driven" collapse will continue. Once that move ends, the technical picture across all timeframes may shift dramatically, but long-term trends still point south. The pound sterling has risen not without cause but again far too strongly and irrationally.
On Monday, the GBP/USD pair may resume its decline, although it would be more accurate to say it might continue its flat movement. The rebound from the 1.2980–1.2993 area indicates a likely drop, but price action remains erratic, and traders are not paying much attention to the macroeconomic backdrop.
On the 5-minute timeframe, the levels to consider for trading are: 1.2301, 1.2372–1.2387, 1.2445, 1.2502–1.2508, 1.2547, 1.2613, 1.2680–1.2685, 1.2723, 1.2791–1.2798, 1.2848–1.2860, 1.2913, 1.2980–1.2993, 1.3043, 1.3102–1.3107. No significant events are scheduled in either the UK or the US on Monday, so the flat market is unlikely to end. However, the rest of the week is packed with significant events in the United States.
Support and Resistance Levels: These are target levels for opening or closing positions and can also serve as points for placing Take Profit orders.
Red Lines: Channels or trendlines indicating the current trend and the preferred direction for trading.
MACD Indicator (14,22,3): A histogram and signal line used as a supplementary source of trading signals.
Important Events and Reports: Found in the economic calendar, these can heavily influence price movements. Exercise caution or exit the market during their release to avoid sharp reversals.
Forex trading beginners should remember that not every trade will be profitable. Developing a clear strategy and practicing proper money management are essential for long-term trading success.
¡Los informes analíticos de InstaForex lo mantendrá bien informado de las tendencias del mercado! Al ser un cliente de InstaForex, se le proporciona una gran cantidad de servicios gratuitos para una operación eficiente.


