 Permanecer
Condiciones de negociación
Products
Herramientas


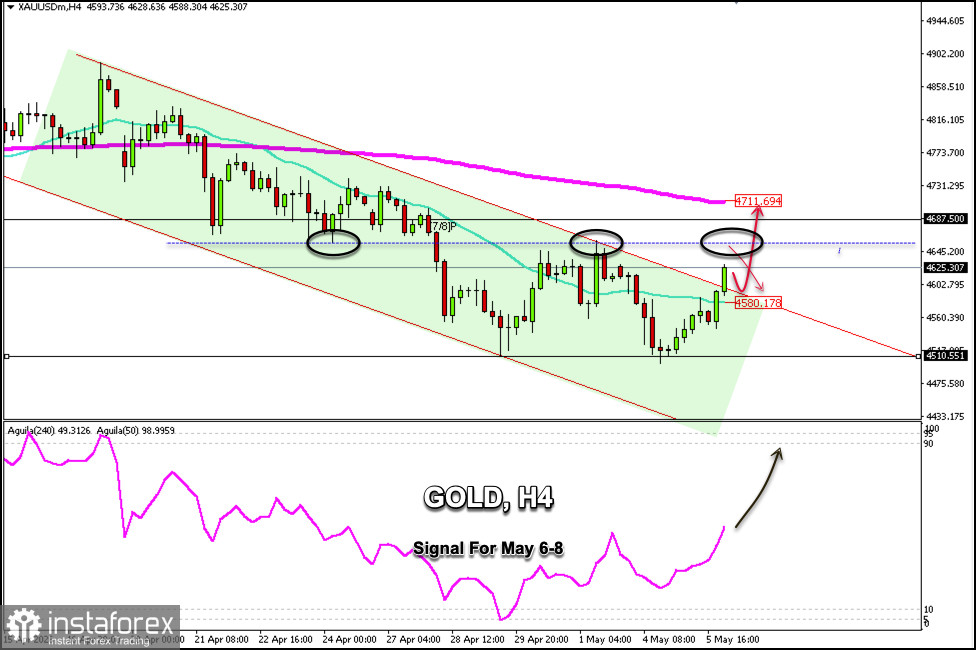
After forming a double bottom pattern around $4,510 and hitting a low of $4,501 during Monday's US trading session, gold is going on with its technical rebound. On the H4 chart, we now see a decisive break above the uptrend channel.
If the gold price consolidates above $4,600 in the coming days, this could be seen as a positive signal to buy, with targets at $4,687 and ultimately at the 200 EMA around $4,711.
According to the H4 chart, gold is breaking out of the bearish trend channel formed since April 16, and we could expect it to reach the daily R_2 around $4,650. After reaching this zone, we could see a technical correction toward the $4,580 area; or, above this zone, we could buy with targets at $4,687 and $4,700.
If the instrument returns and consolidates below the uptrend channel and below the 21 SMA around $4,580, the bearish cycle could resume, potentially reaching the key support at $4,510 and possibly even hitting the 6/8 Murray level at $4,375.
Given that gold has formed a double-bottom technical reversal pattern, it is expected to continue rising in the coming days and could reach the 200 EMA at $4,711 and even return to the April 16 price levels around $4,870.
¡Los informes analíticos de InstaForex lo mantendrá bien informado de las tendencias del mercado! Al ser un cliente de InstaForex, se le proporciona una gran cantidad de servicios gratuitos para una operación eficiente.


