 Permanecer
Condiciones de negociación
Products
Herramientas


The EUR/USD currency pair showed strong growth and decline on Wednesday. Lately, both moves have been triggered by Donald Trump. First, news broke that the U.S. was imposing additional tariffs on China, raising the total rate to an astronomical 104%. Then Trump decided to push it further to 125% (apparently to avoid half-measures) but introduced a 90-day grace period for all other countries, during which a 10% tariff would apply to all imports.
The first announcement pointed to an escalation in the trade war, while the second eased tensions slightly and gave rise to hopes of negotiations and a softer resolution to the trade conflict. However, these "Trump discounts" are unlikely to lead to a strong dollar rally since tariffs remain in place and Trump continues to play his cards in any way he sees fit. From the outside, it looks absurd to impose tariffs and then offer a discount on tariffs.
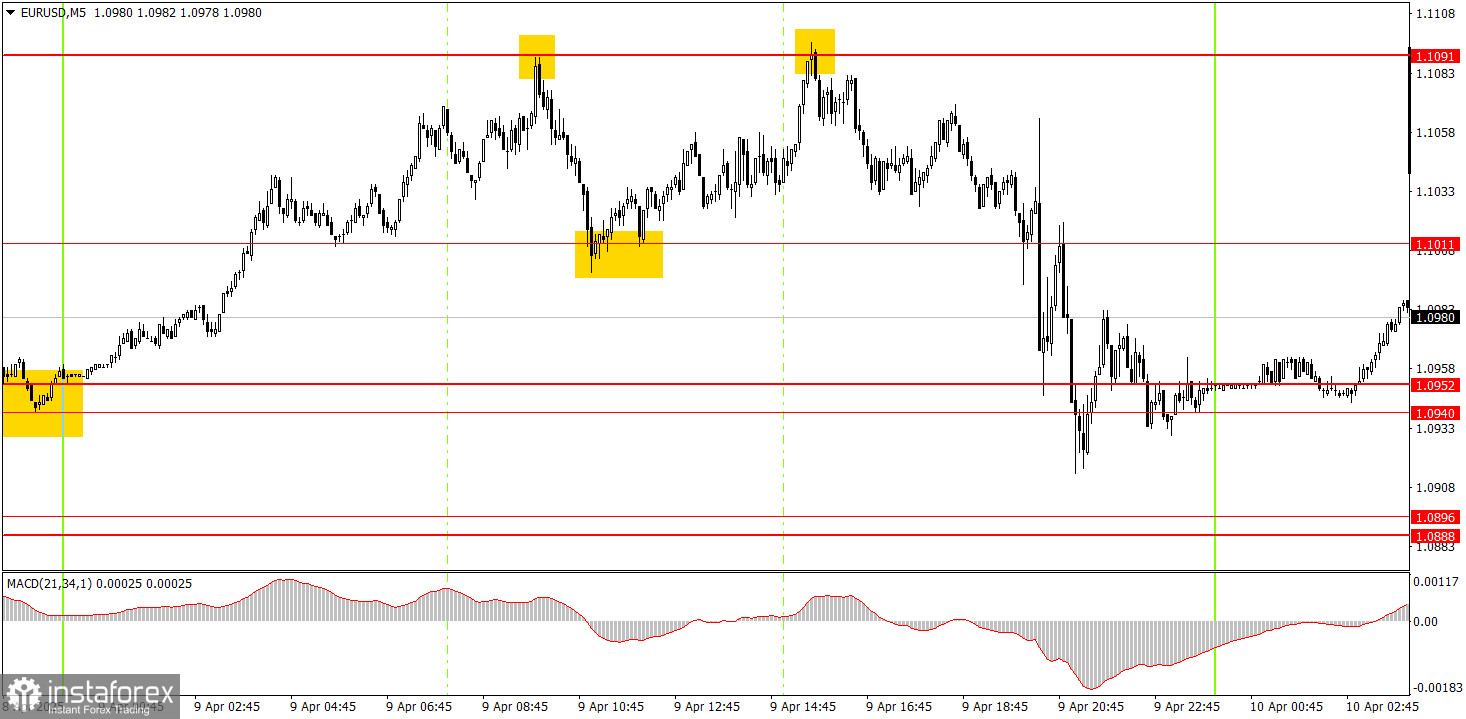
On the 5-minute chart, three trading signals were formed during the day on Wednesday, not counting the sharp evening moves triggered again by Trump. The price bounced three times off the 1.1011 and 1.1091 levels, and the nearest target was hit in each case. Given the strong intraday volatility, novice traders could have made around 150 pips from just these three trades.
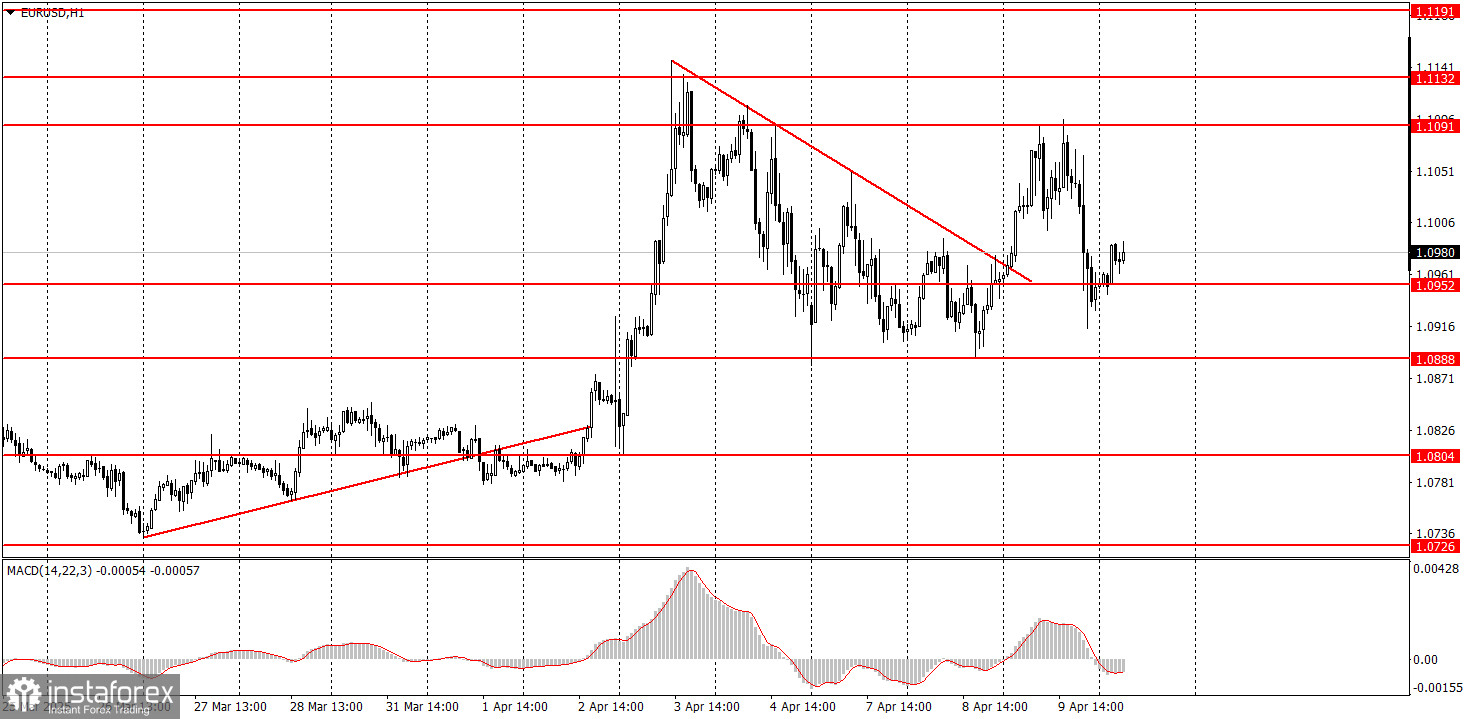
In the 1-hour timeframe, the EUR/USD pair is still in an uptrend. It's uncertain how long this will continue, as no one can predict how many additional tariffs Trump may introduce. Multiple escalations in the trade war are possible since many countries are preparing mirrored responses to U.S. actions. Trump has already stated that any retaliation will provoke further U.S. tariffs. Due to Trump's "discounts," the dollar may strengthen slightly but not significantly, as nothing has fundamentally changed.
On Thursday, markets will likely remain in shock. We won't attempt to predict price movements, as trade-related headlines appear almost every two hours. What's happening in the global markets right now is difficult to describe.
On the 5-minute chart, consider the following levels: 1.0596, 1.0678, 1.0726–1.0733, 1.0797–1.0804, 1.0859–1.0861, 1.0888–1.0896, 1.0940–1.0952, 1.1011, 1.1091, 1.1132–1.1140, 1.1189–1.1191, 1.1275–1.1292.
On Thursday, traders should watch the U.S. inflation report, which currently carries limited significance for market participants. The trade war headlines will remain the top priority.
Support and Resistance Levels: These are target levels for opening or closing positions and can also serve as points for placing Take Profit orders.
Red Lines: Channels or trendlines indicating the current trend and the preferred direction for trading.
MACD Indicator (14,22,3): A histogram and signal line used as a supplementary source of trading signals.
Important Events and Reports: Found in the economic calendar, these can heavily influence price movements. Exercise caution or exit the market during their release to avoid sharp reversals.
Forex trading beginners should remember that not every trade will be profitable. Developing a clear strategy and practicing proper money management are essential for long-term trading success.
¡Los informes analíticos de InstaForex lo mantendrá bien informado de las tendencias del mercado! Al ser un cliente de InstaForex, se le proporciona una gran cantidad de servicios gratuitos para una operación eficiente.


