 Permanecer
Condiciones de negociación
Products
Herramientas


On Monday, the EUR/USD currency pair traded more sideways than upward, although it still gained value by the end of the day. No major macroeconomic or fundamental events were scheduled in the EU or the US, and the markets continued to be influenced by Donald Trump. He announced new tariffs on imports — this time on semiconductors. These tariffs haven't been implemented yet, but they essentially cancel out any positive effect from the "tax holiday" Trump declared for his 90-day exemption list. In essence, Trump is imposing one set of tariffs while freezing another, but the global trade war continues to escalate. As a result, the market remains in a state of panic and chaos, movements are random, and price direction changes frequently.
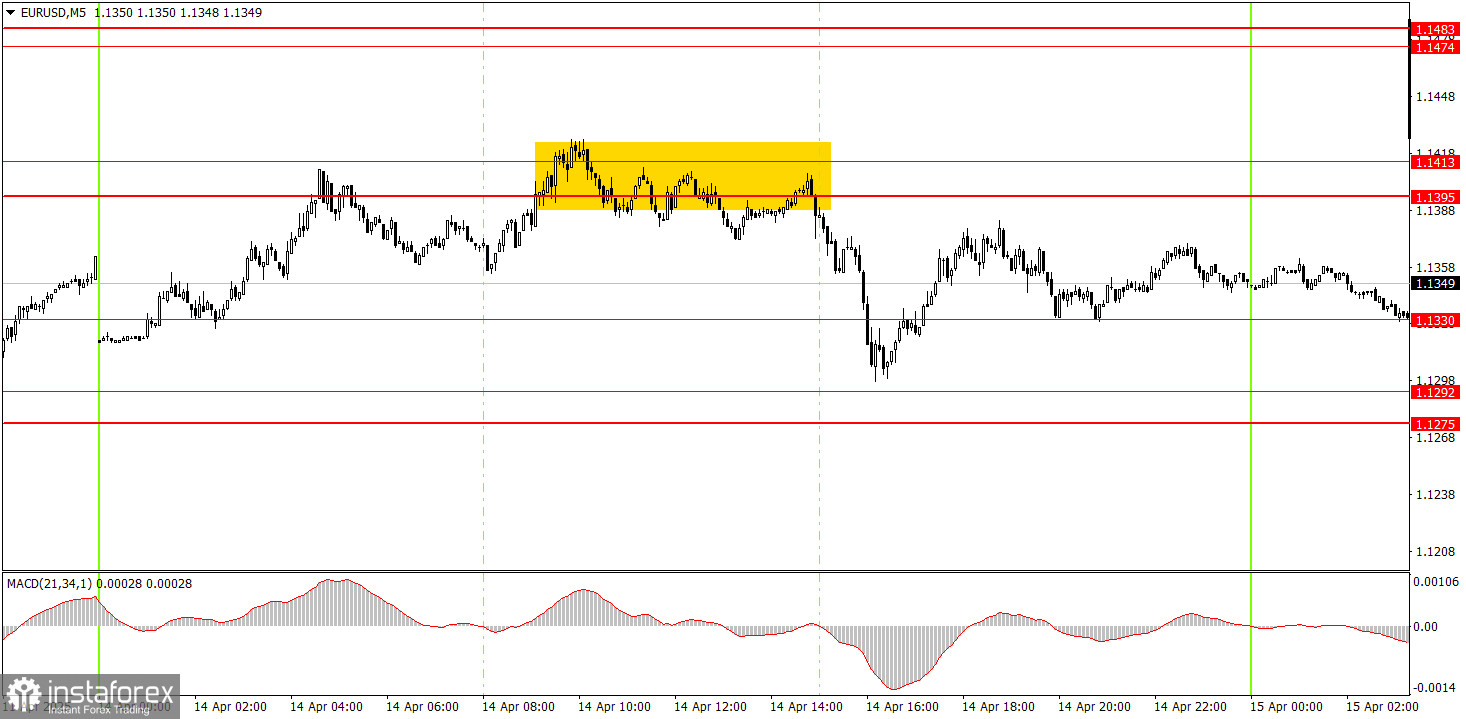
Several trading signals were formed in the 5-minute timeframe on Monday. The price moved sideways during the European trading session but eventually broke away from the 1.1395–1.1413 zone and declined significantly. Unfortunately, that was the day's first and only decent trading signal. As a reminder, market movements are currently highly erratic, so levels and zones are not respected as reliably. The market continues to trade on emotion.
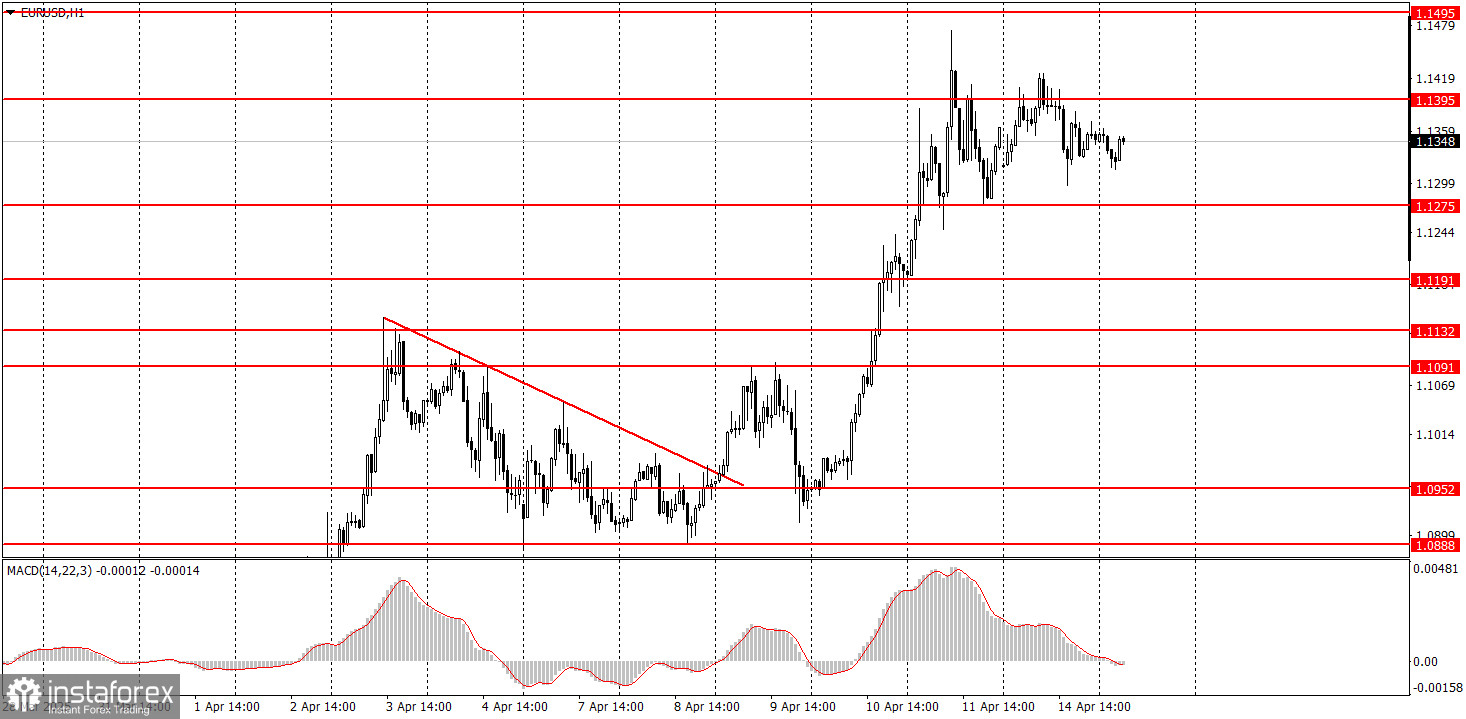
The EUR/USD pair continues its upward trend in the hourly timeframe. How long this will last is unknown, as no one can predict how many more tariffs Trump will introduce. A further trade war escalation is possible as many countries prepare to respond with reciprocal measures — something unlikely to please the U.S. president. Due to Trump's "discounts," the dollar has failed to strengthen, as attention has now shifted to the trade standoff with China, where there are no positive developments.
On Tuesday, markets are likely to remain in a state of shock. We do not attempt to predict price movements since trade-related news emerges almost daily. As such, prices could suddenly spike in either direction—but more likely upward.
On the 5-minute TF, the levels of 1.0797-1.0804, 1.0859-1.0861, 1.0888-1.0896, 1.0940-1.0952, 1.1011, 1.1091, 1.1132-1.1140, 1.1189-1.1191, 1.1275-1.1292, 1.1330, 1.1395-1.1413, 1.1474-1.1483 should be considered. Germany and the EU will release minor ZEW economic sentiment indices on Tuesday. These may trigger some market reaction but are unlikely to have a lasting or significant impact.
Support and Resistance Levels: These are target levels for opening or closing positions and can also serve as points for placing Take Profit orders.
Red Lines: Channels or trendlines indicating the current trend and the preferred direction for trading.
MACD Indicator (14,22,3): A histogram and signal line used as a supplementary source of trading signals.
Important Events and Reports: Found in the economic calendar, these can heavily influence price movements. Exercise caution or exit the market during their release to avoid sharp reversals.
Forex trading beginners should remember that not every trade will be profitable. Developing a clear strategy and practicing proper money management are essential for long-term trading success.
¡Los informes analíticos de InstaForex lo mantendrá bien informado de las tendencias del mercado! Al ser un cliente de InstaForex, se le proporciona una gran cantidad de servicios gratuitos para una operación eficiente.


