 Permanecer
Condiciones de negociación
Products
Herramientas


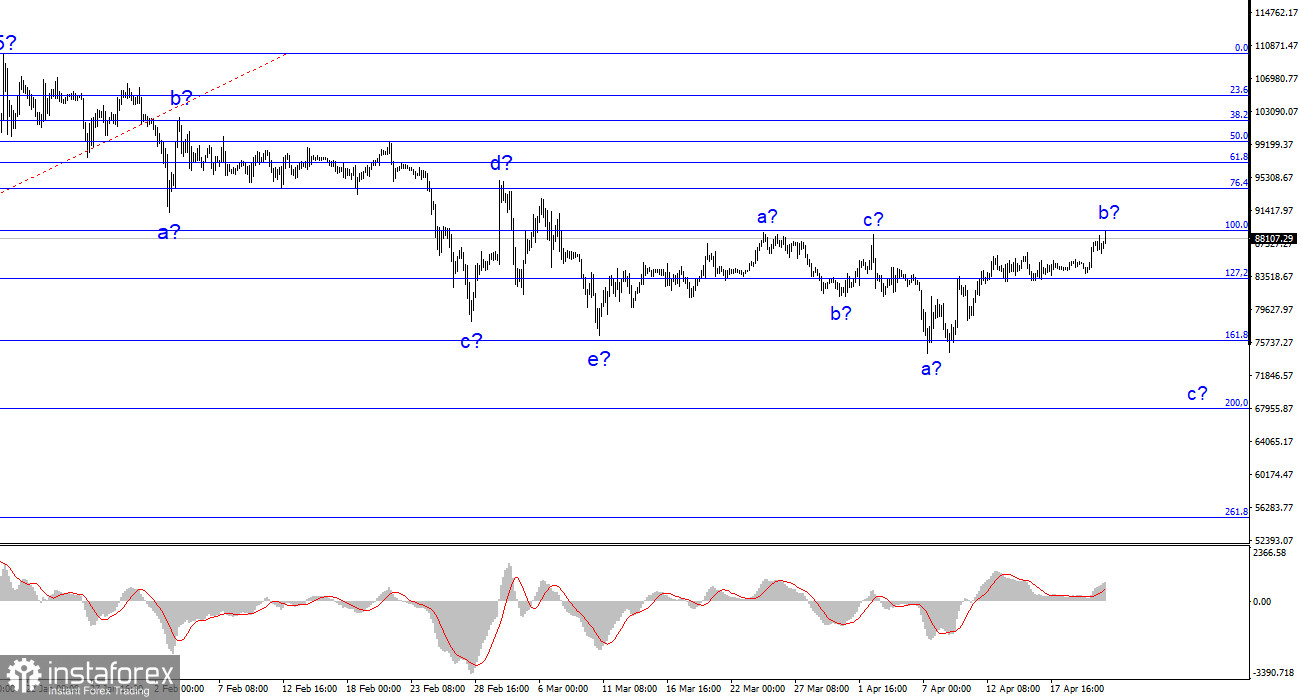
The wave structure on the 4-hour chart for BTC/USD is quite clear. After completing an upward trend consisting of five full waves, a downward segment began forming, which currently appears corrective.Therefore, I have not expected Bitcoin to rise above the $110,000–$115,000 range in the coming months.
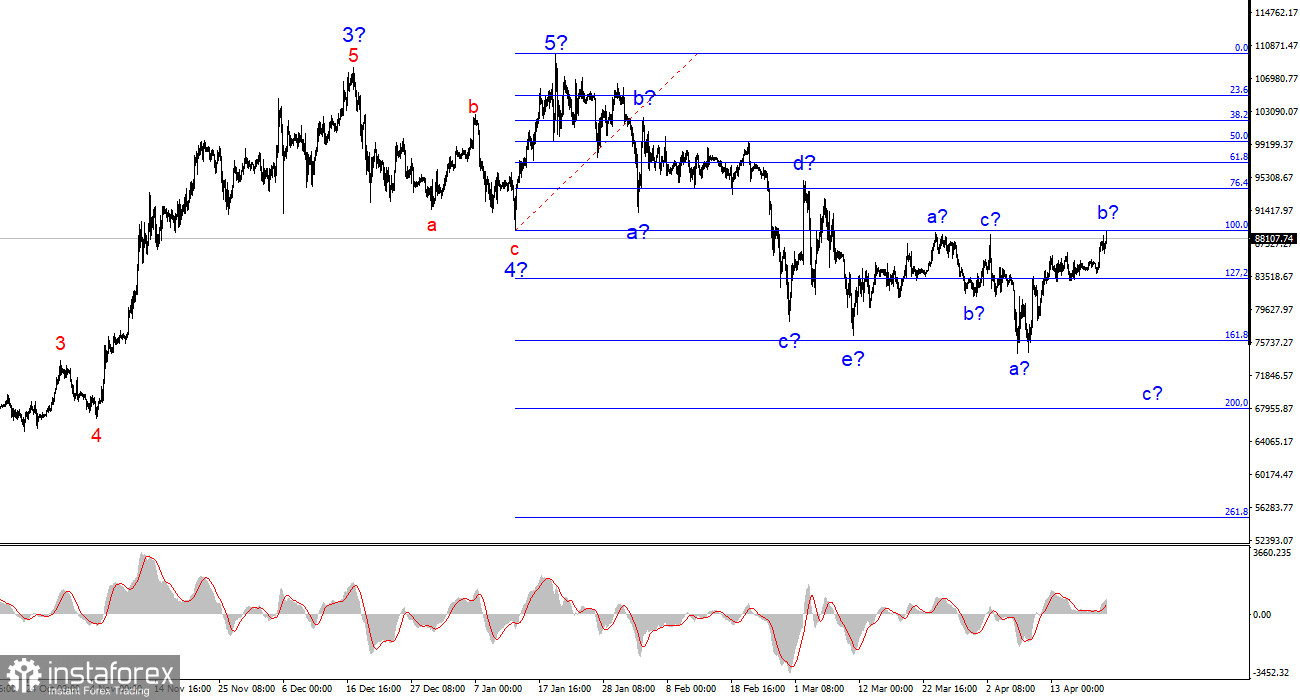
The news background has supported Bitcoin for a long time thanks to a steady stream of investment headlines involving institutional traders, some governments, and even pension funds. However, Trump's policies have driven investors away from the market. The wave starting on January 20 does not resemble an impulsive one. Therefore, we are dealing with a complex corrective structure that may take months to complete. We've seen another a-b-c upward sequence, followed by the beginning of a new downward wave set. Wave b appears to be complete, so we should expect wave c and a new decline in Bitcoin.
BTC/USD has risen by $14,000 recently, which is a substantial gain, especially amid the development of a downward trend. The presumed wave b in the new structure is quite extended, but the overall trend remains bearish. At the moment, the price has returned to the $88,960 level (100.0% Fibonacci level) for the third time. A third failed attempt to break this level will indicate the market's readiness for renewed Bitcoin selling. The wave structure thus favors another decline in Bitcoin.
However, the news background shouldn't be ignored. Recently, reduced demand for Bitcoin has been tied to the White House's policies. Due to protectionist and aggressive actions against many countries, investors have turned to safer assets than stocks or cryptocurrencies. That said, there are now rumors circulating online that the Fed may return to a quantitative easing (QE) program. Let me remind you: QE is essentially injecting more money into the economy. In my view, expanding QE with the Fed's current high interest rates is unrealistic. The Fed would first need to lower rates to neutral levels and only then assess the economy's state. If rate cuts are insufficient, QE could be considered.
In any case, the U.S. economy has not shown signs of major deterioration so far. Fed Chair Jerome Powell has stated multiple times that monetary policy easing is not planned in the near term. Therefore, I personally doubt we'll see a QE program or rate cuts at upcoming meetings. However, if the market believes in QE, that alone could support Bitcoin demand. For now, I recommend focusing on the $88,960 level.
Based on the analysis of BTC/USD, I conclude that the development of a downward trend continues. Everything points to a complex, multi-month correction ahead. That's why I previously advised against buying cryptocurrencies—and now even more so. Given this, I believe the best option is to look for short opportunities. From the $88,960 level, Bitcoin may resume its decline toward the $67,900 level, which aligns with the 200.0% Fibonacci extension, especially since we've already seen wave b of the new downward structure. However, a successful breakout above $88,960 would require adjustments to the current wave count.
On the higher wave timeframe, a five-wave upward structure is clearly visible. At present, a corrective, downward structure—or even a full-fledged downward trend—has begun forming.
Core Principles of My Analysis:
¡Los informes analíticos de InstaForex lo mantendrá bien informado de las tendencias del mercado! Al ser un cliente de InstaForex, se le proporciona una gran cantidad de servicios gratuitos para una operación eficiente.


