 Permanecer
Condiciones de negociación
Products
Herramientas


On Thursday, the GBP/USD pair continued its downward movement, although the overall picture still closely resembles a sideways range. The British pound maintains a bullish bias, but its recent growth has been much weaker compared to earlier periods. As with the euro, there were no fundamental reasons behind the dollar's three-day rally. Let's recall that just on Wednesday, the U.S. GDP report for Q1 posted a negative value for the first time in three years. The JOLTS report was disappointing, the ADP jobs report missed expectations, and the ISM Manufacturing PMI was lower than the previous month. Therefore, we believe the dollar had no justification for its rise. Still, the market continues to trade based on its expectations, and such moves appear chaotic on the charts. Participants often ignore technical levels.
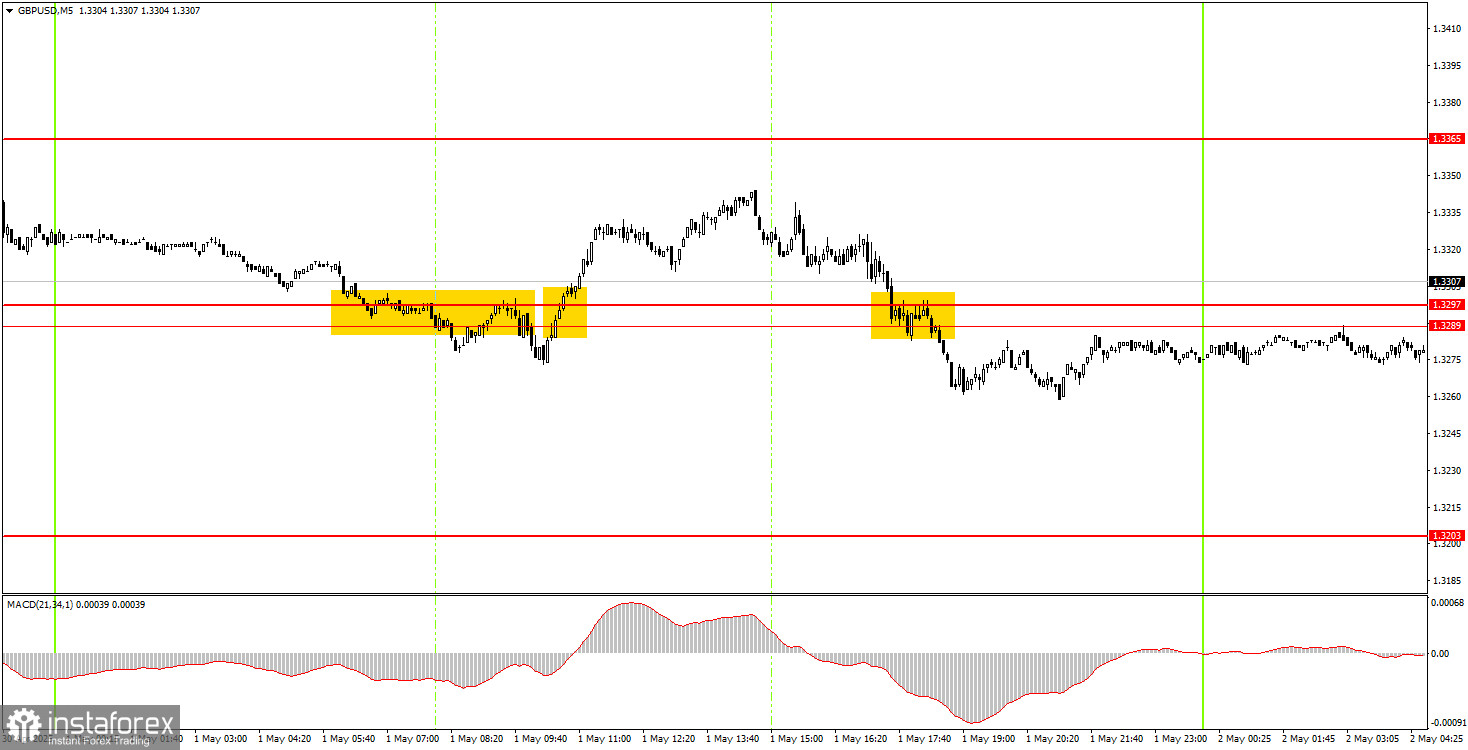
On Thursday, several subpar trading signals were generated in the 5-minute timeframe. All three signals turned out to be false due to weak volatility and the market's general confusion about what to do with the dollar. The macroeconomic backdrop has virtually no influence on the pair's movements.
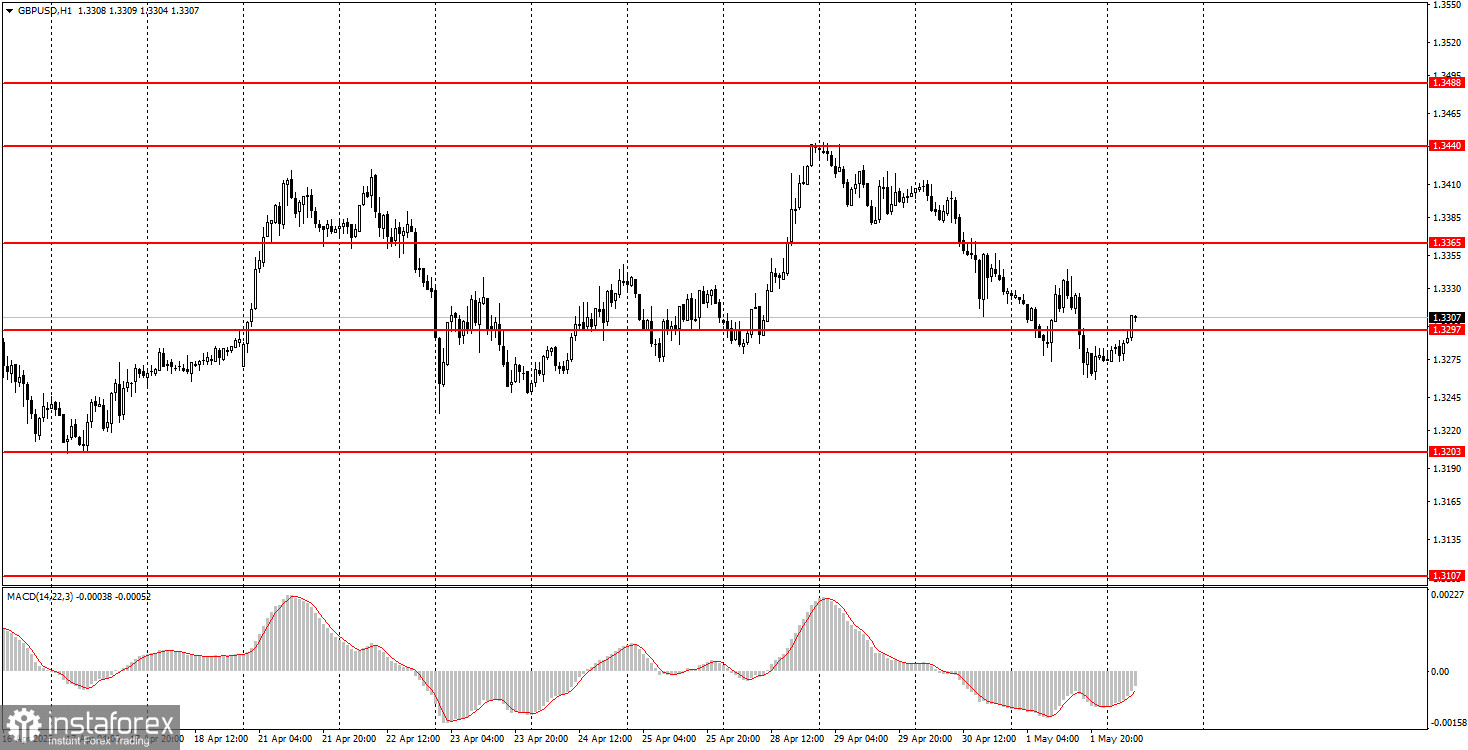
On the hourly chart, GBP/USD could have entered a downward trend long ago, but the market continues to focus entirely on Donald Trump. As a result, the pound continues to climb steadily, albeit with uncertainty. Thus, future price movements remain tied to the U.S. president and his decisions and little else. Maybe the market will start paying attention to fundamentals again in the future—but that moment hasn't arrived yet.
On Friday, GBP/USD may begin a new upward wave. U.S. data has collapsed across the board this week, and there's no reason to believe Friday's numbers will support the dollar. However, the market could also completely ignore them.
On the 5-minute timeframe, trading can currently be conducted around the following levels: 1.2848–1.2860, 1.2913, 1.2980–1.2993, 1.3043, 1.3102–1.3107, 1.3145–1.3167, 1.3203, 1.3289–1.3297, 1.3365, 1.3421–1.3440, 1.3488, 1.3537, 1.3580–1.3598. Once again, there are no significant events scheduled in the UK for Friday, while the U.S. will publish its NonFarm Payrolls and unemployment rate reports. U.S. data have become a new headache for the dollar, but let's recall that the market currently pays no attention to them. Technically, the dollar could continue to rise despite poor data from across the Atlantic.
Support and Resistance Levels: These are target levels for opening or closing positions and can also serve as points for placing Take Profit orders.
Red Lines: Channels or trendlines indicating the current trend and the preferred direction for trading.
MACD Indicator (14,22,3): A histogram and signal line used as a supplementary source of trading signals.
Important Events and Reports: Found in the economic calendar, these can heavily influence price movements. Exercise caution or exit the market during their release to avoid sharp reversals.
Note for Beginner Forex Traders: Not every trade can be profitable. Developing a clear strategy and sound money management is key to long-term success in trading.
¡Los informes analíticos de InstaForex lo mantendrá bien informado de las tendencias del mercado! Al ser un cliente de InstaForex, se le proporciona una gran cantidad de servicios gratuitos para una operación eficiente.


