 Permanecer
Condiciones de negociación
Products
Herramientas


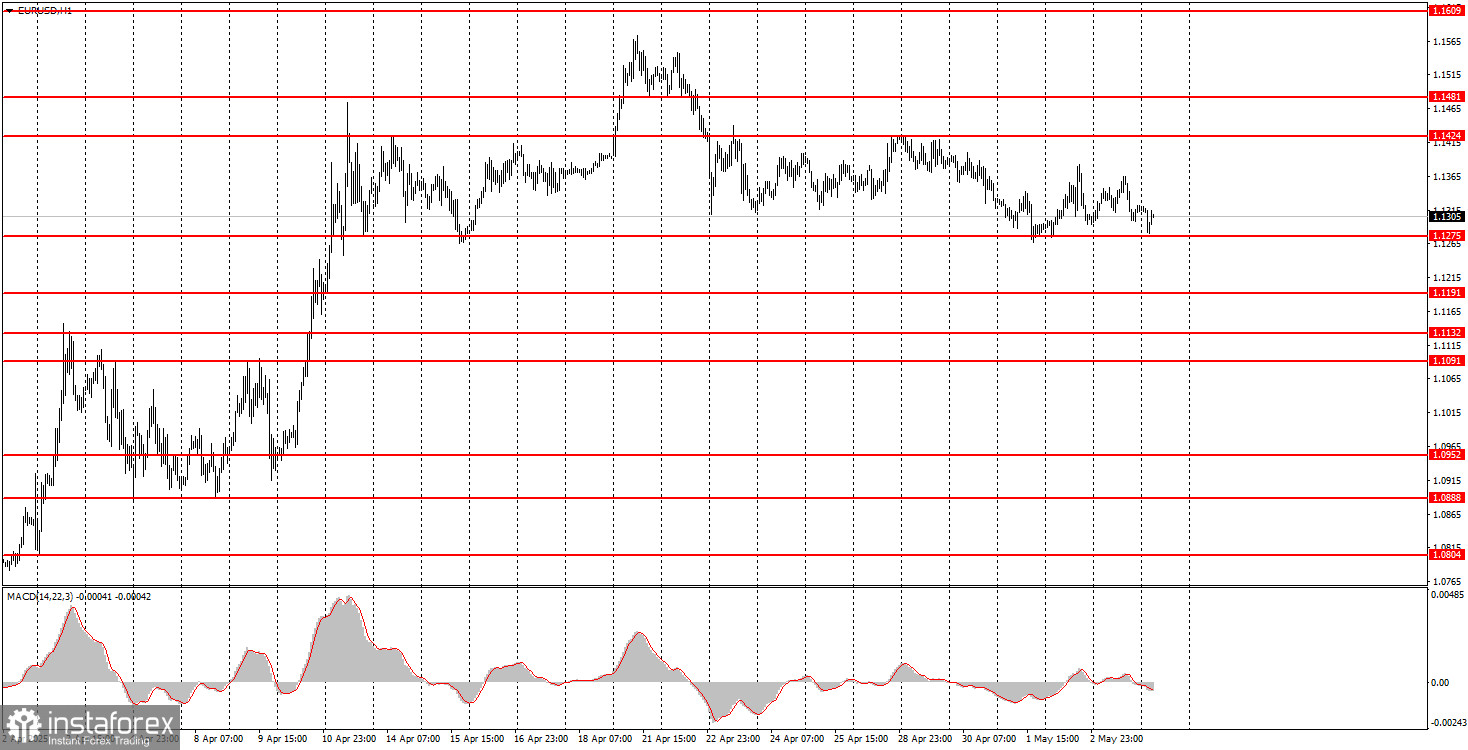
On Monday, the EUR/USD currency pair once again traded both upward and downward, confirming the presence of a flat market. The price has been predominantly moving between the levels of 1.1275 and 1.1424 for more than three weeks now. It is situated near the lower boundary of the sideways channel, so a rebound and a new upward move can be expected — one that wouldn't require any fundamental or macroeconomic justification.
On Monday, Donald Trump "woke up" after a three-week silence and introduced new tariffs. This time, they targeted the film industry with a 100% tariff on imported movies. Additionally, the ISM Services PMI for the U.S. was published and unexpectedly came in higher than forecast, which helped the dollar in the second half of the day. However, there's little point in that report or the market's reaction to it, as the pair remains within the bounds of the sideways range.
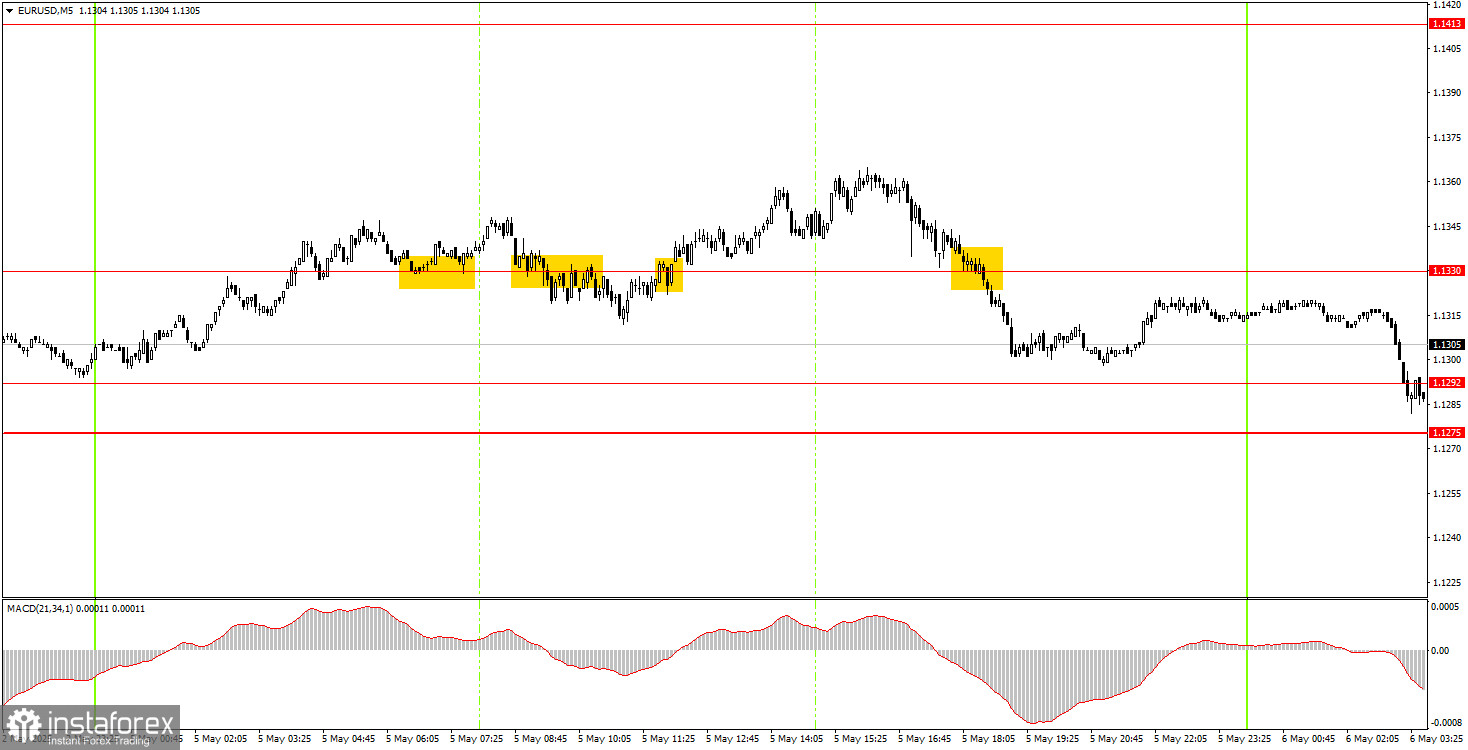
Four trade signals were formed on Monday in the 5-minute timeframe, but all occurred within a flat market. Simply put, no matter how good the levels and signals are, when the price only moves sideways, it becomes very difficult to secure profits. Not a single signal reached its closest target. Therefore, we remind novice traders that market movements remain chaotic and that participants often ignore macroeconomic data altogether.
On the hourly timeframe, EUR/USD retains a general upward trend. Excluding early last week's movements, the market has been in a sideways range near its highs for three weeks. Overall, the sentiment remains negative toward the U.S. dollar and everything associated. However, if Trump chooses to de-escalate the trade conflict — which he initiated — the dollar may be able to recover. Whether or when that will happen remains unknown.
On Tuesday, the pair may move again in any direction, as market movements are still driven almost entirely by Trump's statements and decisions. Given Trump's lack of recent updates, we believe the flat trend is likely to persist for a while. A rebound from the lower boundary of the range (1.1275) could result in a rise.
On the 5-minute TF we should consider the levels of 1.0940-1.0952, 1.1011, 1.1091, 1.1132-1.1140, 1.1189-1.1191, 1.1275-1.1292, 1.1330, 1.1413-1.1424, 1.1474-1.1481, 1.1513, 1.1548, 1.1571, 1.1607-1.1622, 1.1666, 1.1689. On Tuesday, the Eurozone will publish the second estimates of the Services PMI indices. In the U.S., no significant releases are scheduled. Therefore, we do not anticipate an end to the current flat movement today.
Support and Resistance Levels: These are target levels for opening or closing positions and can also serve as points for placing Take Profit orders.
Red Lines: Channels or trendlines indicating the current trend and the preferred direction for trading.
MACD Indicator (14,22,3): A histogram and signal line used as a supplementary source of trading signals.
Important Events and Reports: Found in the economic calendar, these can heavily influence price movements. Exercise caution or exit the market during their release to avoid sharp reversals.
Forex trading beginners should remember that not every trade will be profitable. Developing a clear strategy and practicing proper money management are essential for long-term trading success.
¡Los informes analíticos de InstaForex lo mantendrá bien informado de las tendencias del mercado! Al ser un cliente de InstaForex, se le proporciona una gran cantidad de servicios gratuitos para una operación eficiente.


