 Permanecer
Condiciones de negociación
Products
Herramientas


On Monday, the GBP/USD pair continued to trade strictly sideways. Although we don't see a clearly defined flat range for the pound, the bias is still more sideways than upward. Early in the day, the pair posted a slight rise on the news of Donald Trump's new import tariffs, followed by a drop after the release of the U.S. ISM Services PMI. In both cases, the volatility was low. Overall, the market remains waiting for new tariffs, a de-escalation in the global trade war, government reshuffles in the Trump administration, and other high-impact news from the White House.
Last week, the market largely ignored an entire series of macroeconomic reports. The same could happen this week with the Bank of England and Federal Reserve meetings. Even though the BoE is expected to cut the key rate on Thursday, the British pound doesn't appear concerned.
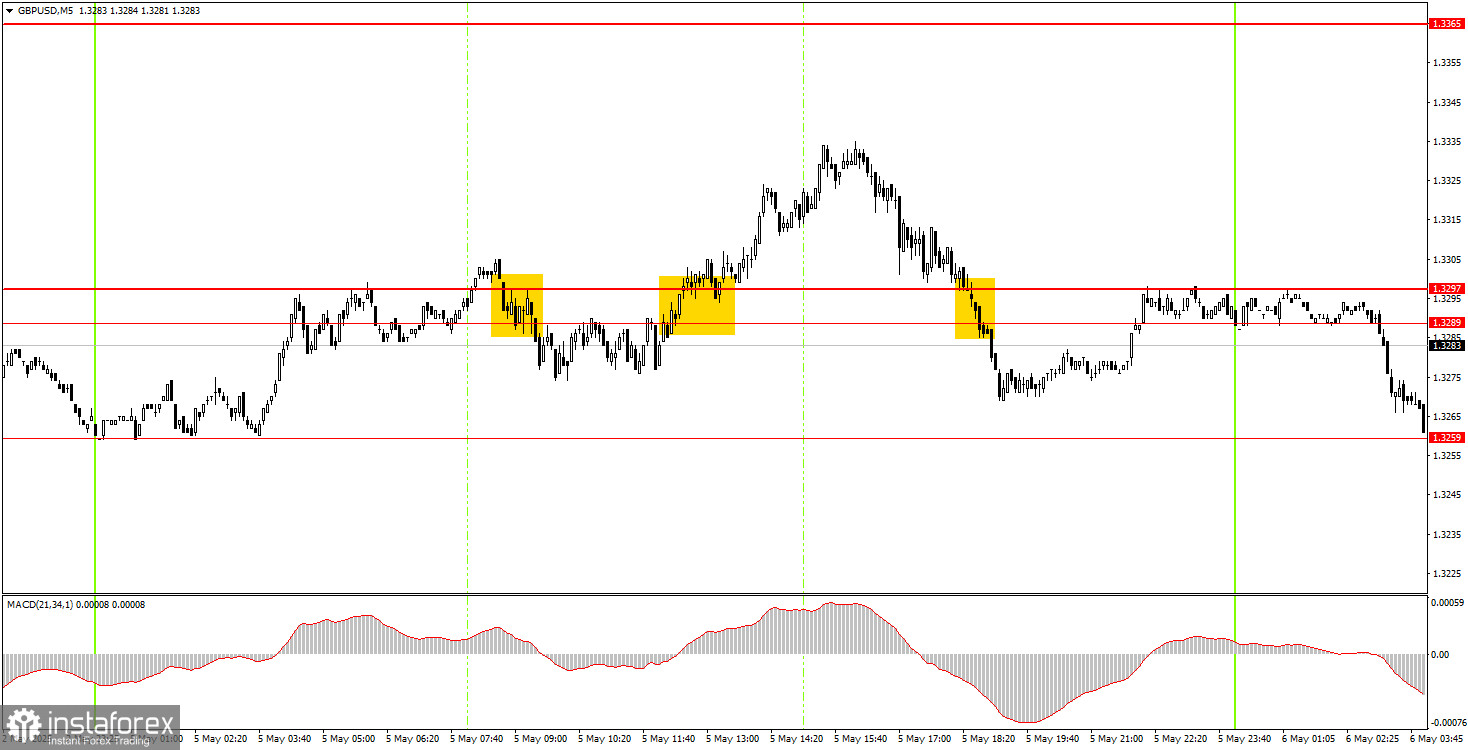
On Monday, several trading signals were formed in the 5-minute timeframe, but once again, their accuracy left much to be desired. All signals clustered around the 1.3289–1.3297 area, and the price crossed back and forth without meaningful pauses. Unfortunately, the market is currently not only range-bound but also chaotic. Logical, technically driven movements remain very limited.
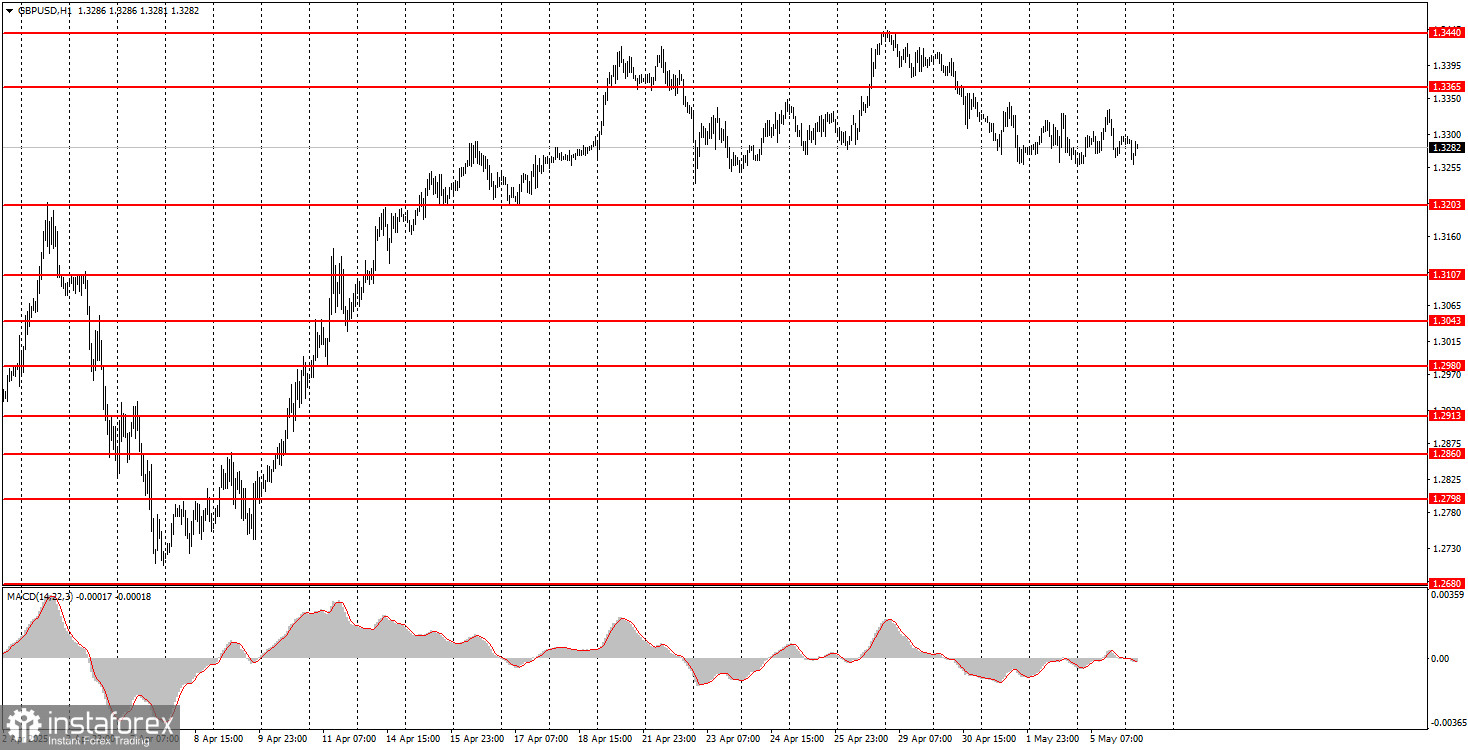
On the hourly timeframe, GBP/USD could have begun a downtrend long ago, but the market continues to focus solely on Trump. As a result, the pound continues to climb — or at least hold its elevated levels. Future movements in the pair still depend almost entirely on the U.S. president and his decisions. Perhaps this focus will shift eventually, but there's no sign of that happening for now.
On Tuesday, GBP/USD may begin a new leg higher. Last week's U.S. economic data was broadly disappointing, and there is little reason to expect an improvement in the near term. For the dollar, only a technical rebound is possible at this stage.
On the 5-minute timeframe, you can now trade at the levels of 1.2848-1.2860, 1.2913, 1.2980-1.2993, 1.3043, 1.3102-1.3107, 1.3145-1.3167, 1.3203, 1.3259, 1.3329, 1.3365, 1.3421-1.3440, 1.3488, 1.3537, 1.3580-1.3598. On Tuesday, the UK will release the second estimate of the Services PMI, while no major data is expected from the U.S. We do not anticipate high volatility or any trend-driven moves today.
Support and Resistance Levels: These are target levels for opening or closing positions and can also serve as points for placing Take Profit orders.
Red Lines: Channels or trendlines indicating the current trend and the preferred direction for trading.
MACD Indicator (14,22,3): A histogram and signal line used as a supplementary source of trading signals.
Important Events and Reports: Found in the economic calendar, these can heavily influence price movements. Exercise caution or exit the market during their release to avoid sharp reversals.
Forex trading beginners should remember that not every trade will be profitable. Developing a clear strategy and practicing proper money management are essential for long-term trading success.
¡Los informes analíticos de InstaForex lo mantendrá bien informado de las tendencias del mercado! Al ser un cliente de InstaForex, se le proporciona una gran cantidad de servicios gratuitos para una operación eficiente.


