 Permanecer
Condiciones de negociación
Products
Herramientas


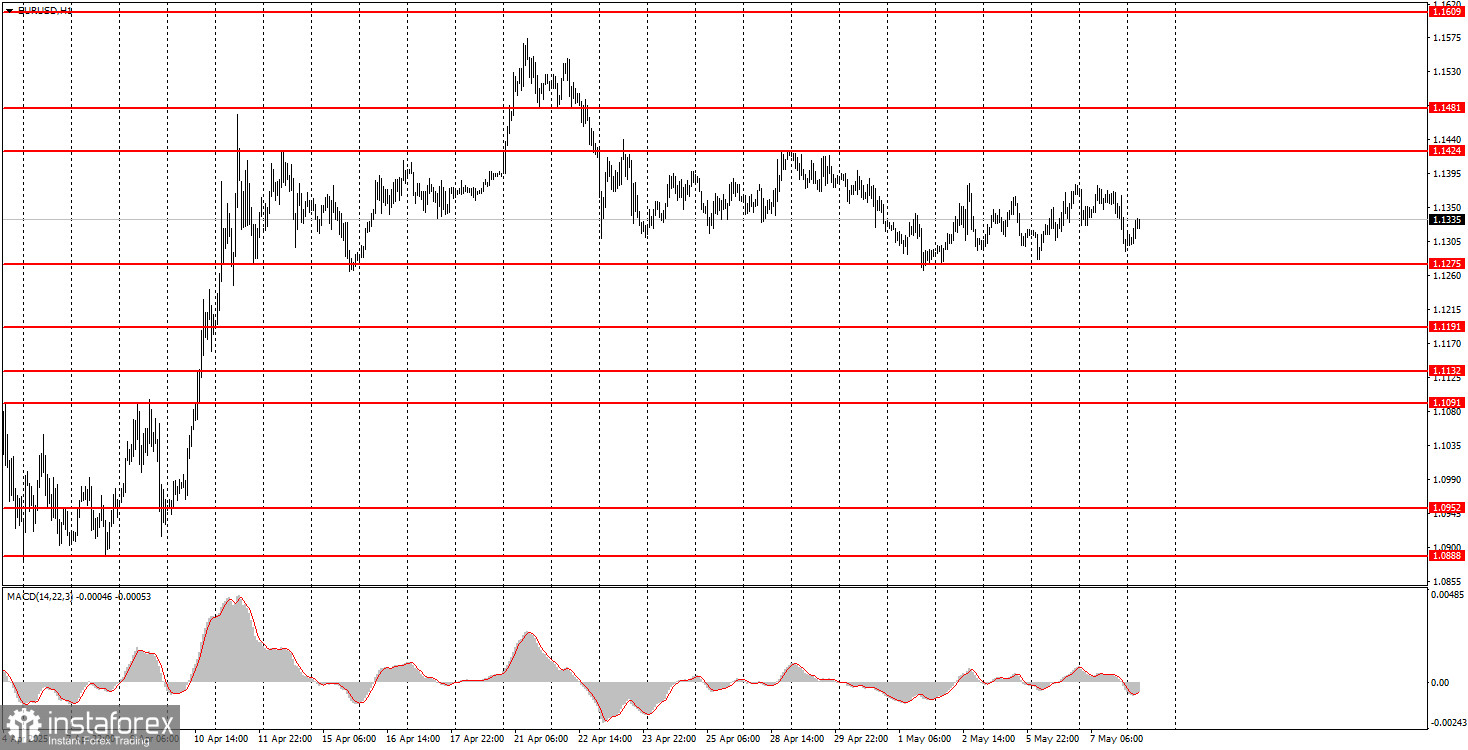
The EUR/USD currency pair continued to trade within the sideways channel on Wednesday, which is visible on the hourly timeframe. As we warned, the Federal Reserve meeting did not change anything. While we saw minimal market reaction, it had no real impact. The Fed decided to leave the key interest rate unchanged, and Jerome Powell once again spoke about economic uncertainty and the need to wait some time to see the full effect of Trump's tariffs. As a result, there were no changes to monetary policy, and Powell made no announcements about potential future easing. The U.S. dollar could have strengthened, but the market continues to ignore nearly all news unrelated to the trade war. The sideways trend continues.
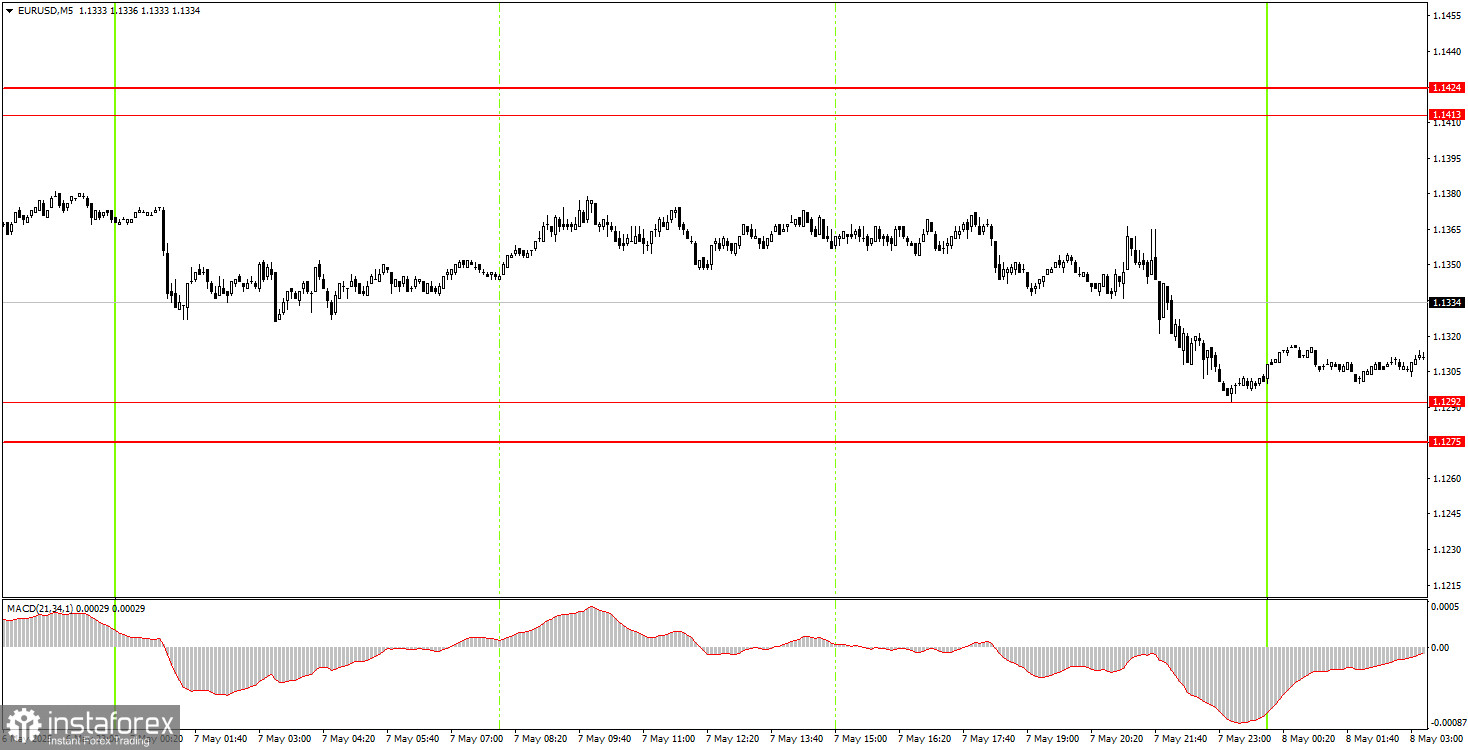
On the 5-minute timeframe, no trading signals were generated on Wednesday, and volatility remained low until the evening. As a reminder, we do not recommend opening positions right before or immediately after the announcement of central bank decisions. Therefore, movements during that period are excluded from our analysis. Even including those movements, only a buy signal was formed late at night near the 1.1292 level, which should not have been acted upon.
On the hourly chart, EUR/USD maintains a bullish trend, but the market has been in a three-week sideways range at high levels. Overall, sentiment remains extremely negative toward the U.S. dollar, but if Trump signals a move toward de-escalating the trade conflict, which he initiated, then the dollar could recover. Whether that happens, or when it happens, remains unknown.
The pair can move in either direction on Thursday, as market movements still depend on Trump's statements and decisions. Since there has been little news from him lately, we anticipate that the sideways movement will likely continue. A bounce from the lower boundary of the range (1.1275) triggered growth in the pair, and a bounce from the 1.1292 level may also fuel further upside.
On the 5-minute timeframe, consider the following levels: 1.0940–1.0952, 1.1011, 1.1091, 1.1132–1.1140, 1.1189–1.1191, 1.1275–1.1292, 1.1413–1.1424, 1.1474–1.1481, 1.1513, 1.1548, 1.1571, 1.1607–1.1622, 1.1666, 1.1689. On Thursday, the Eurozone will release a largely irrelevant report on German industrial production, while the U.S. will publish an even less important report on jobless claims. It's unlikely that the sideways trend will end today.
Support and Resistance Levels: These are target levels for opening or closing positions and can also serve as points for placing Take Profit orders.
Red Lines: Channels or trendlines indicating the current trend and the preferred direction for trading.
MACD Indicator (14,22,3): A histogram and signal line used as a supplementary source of trading signals.
Important Events and Reports: Found in the economic calendar, these can heavily influence price movements. Exercise caution or exit the market during their release to avoid sharp reversals.
Forex trading beginners should remember that not every trade will be profitable. Developing a clear strategy and practicing proper money management are essential for long-term trading success.
¡Los informes analíticos de InstaForex lo mantendrá bien informado de las tendencias del mercado! Al ser un cliente de InstaForex, se le proporciona una gran cantidad de servicios gratuitos para una operación eficiente.


