 Permanecer
Condiciones de negociación
Products
Herramientas


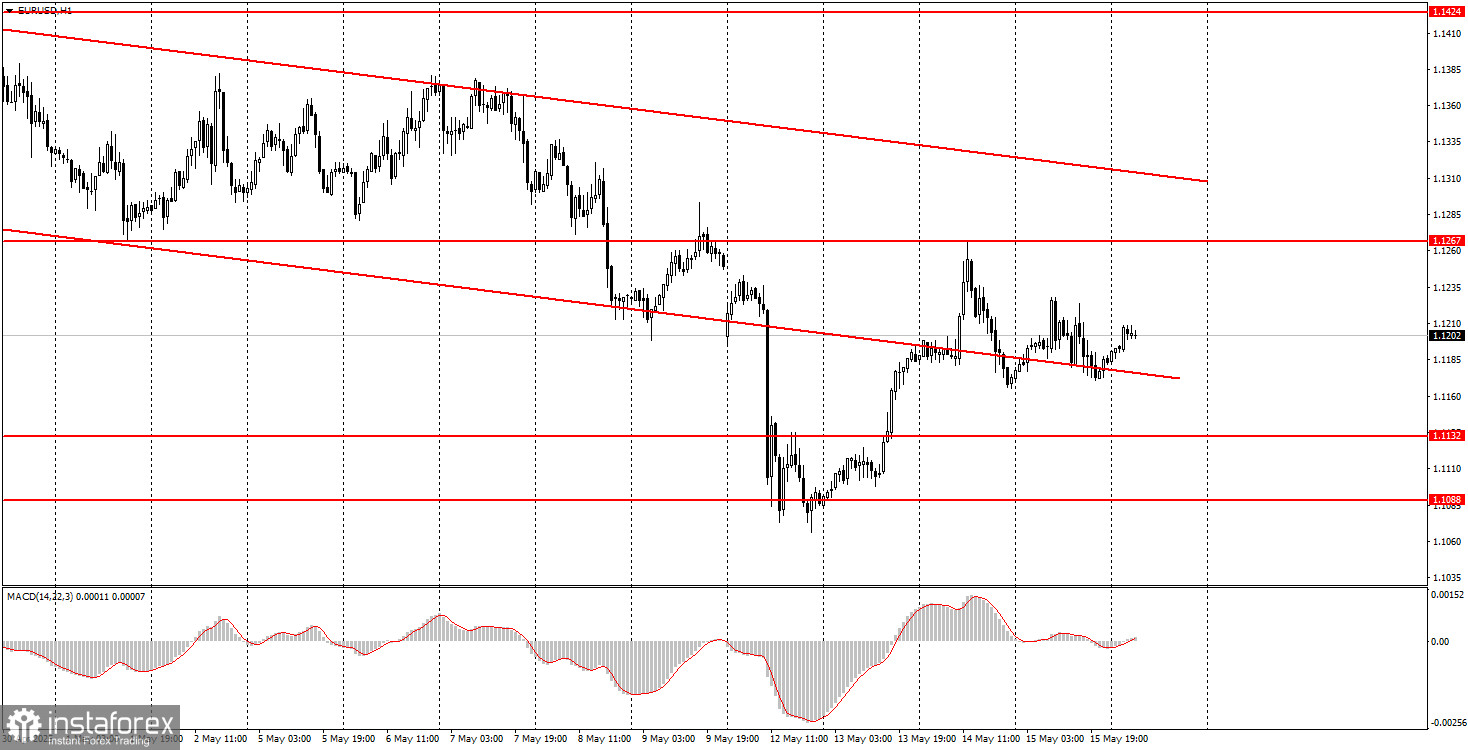
The EUR/USD currency pair traded in both directions throughout Thursday. The macroeconomic background was rich, but it had no decisive impact as we anticipated. Many reports offset each other, while others were ignored due to their low significance. For example, the second estimate of the Eurozone's Q1 GDP was worse than the first, yet industrial production grew more than expected. In the U.S., retail sales exceeded forecasts by just 0.1%, while the Producer Price Index showed a sharp 0.5% decline. Still, the market either didn't know what to do with this data or did not want to react to it. As previously stated, the trade war news remains our top priority. The market still shows no urgency to buy the dollar, even though global trade tensions are slowly easing. The downtrend on the hourly timeframe remains intact, though it's not particularly strong.
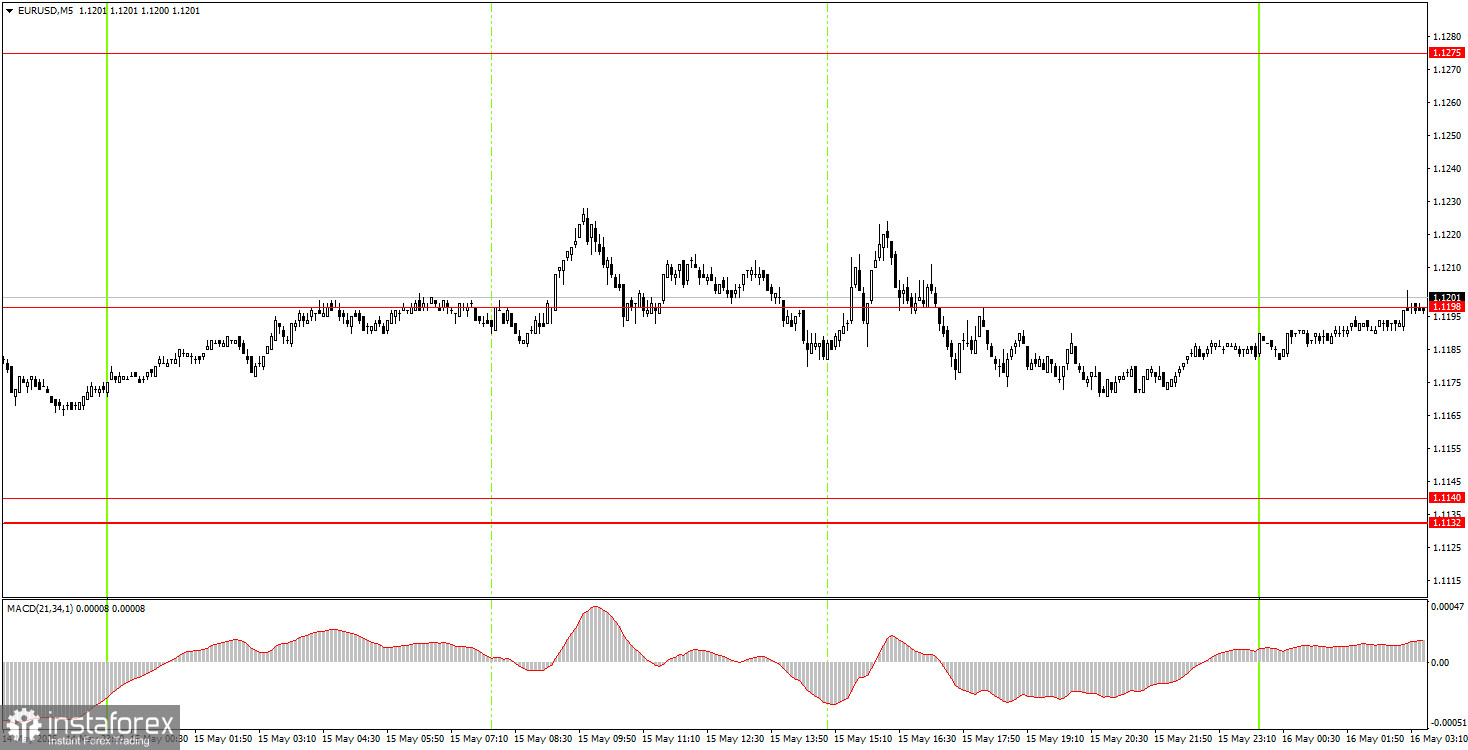
On the 5-minute timeframe, the pair completely ignored the key level 1.1198 throughout Thursday. This level had been functioning well the day before, but Thursday's abundance of macroeconomic reports only confused traders. Volatility was weak, and the price constantly changed direction. As a result, it was tough to find a strong signal and profit from it.
In the hourly timeframe, the EUR/USD pair finally formed a semblance of a downward trend. Overall, market sentiment remains highly negative toward the U.S. dollar. However, with Trump now pursuing de-escalation in the trade conflict he started, the dollar could improve its position soon. The strength of the dollar's growth will depend on how many trade agreements can be signed. High-impact news from Trump, like firing Powell or new tariff threats, will also play a role.
On Friday, the EUR/USD pair will trade based primarily on technical factors. Given today's weak macroeconomic background, another flat (sideways) day cannot be ruled out.
On the 5-minute timeframe, consider the following levels: 1.0940–1.0952, 1.1011, 1.1088, 1.1132–1.1140, 1.1198, 1.1275–1.1292, 1.1413–1.1424, 1.1474–1.1481, 1.1513, 1.1548, 1.1571, 1.1607–1.1622. No noteworthy reports or events are scheduled in the Eurozone for Friday, and the U.S. will release only secondary reports, among which the University of Michigan Consumer Sentiment Index may be of mild interest. We believe the probability of flat trading remains high today.
Support and Resistance Levels: These are target levels for opening or closing positions and can also serve as points for placing Take Profit orders.
Red Lines: Channels or trendlines indicating the current trend and the preferred direction for trading.
MACD Indicator (14,22,3): A histogram and signal line used as a supplementary source of trading signals.
Important Events and Reports: Found in the economic calendar, these can heavily influence price movements. Exercise caution or exit the market during their release to avoid sharp reversals.
Forex trading beginners should remember that not every trade will be profitable. Developing a clear strategy and practicing proper money management are essential for long-term trading success.
¡Los informes analíticos de InstaForex lo mantendrá bien informado de las tendencias del mercado! Al ser un cliente de InstaForex, se le proporciona una gran cantidad de servicios gratuitos para una operación eficiente.


