 Permanecer
Condiciones de negociación
Products
Herramientas


On Friday, the GBP/USD pair also traded lower, although there were no objective reasons. While the euro maintains a downward trend, the British pound's trend appears more sideways. Therefore, it can't be said that the pound declined in line with its prevailing direction. Instead, it showed another round of random movement within a flat range, for which no events or news were required. Among Friday's macroeconomic events, we can highlight the University of Michigan Consumer Sentiment Index, which came in below forecasts and lower than the previous value. Reports on building permits and housing starts also missed expectations. But what's the point of highlighting this if the market ignores the macroeconomic background altogether?
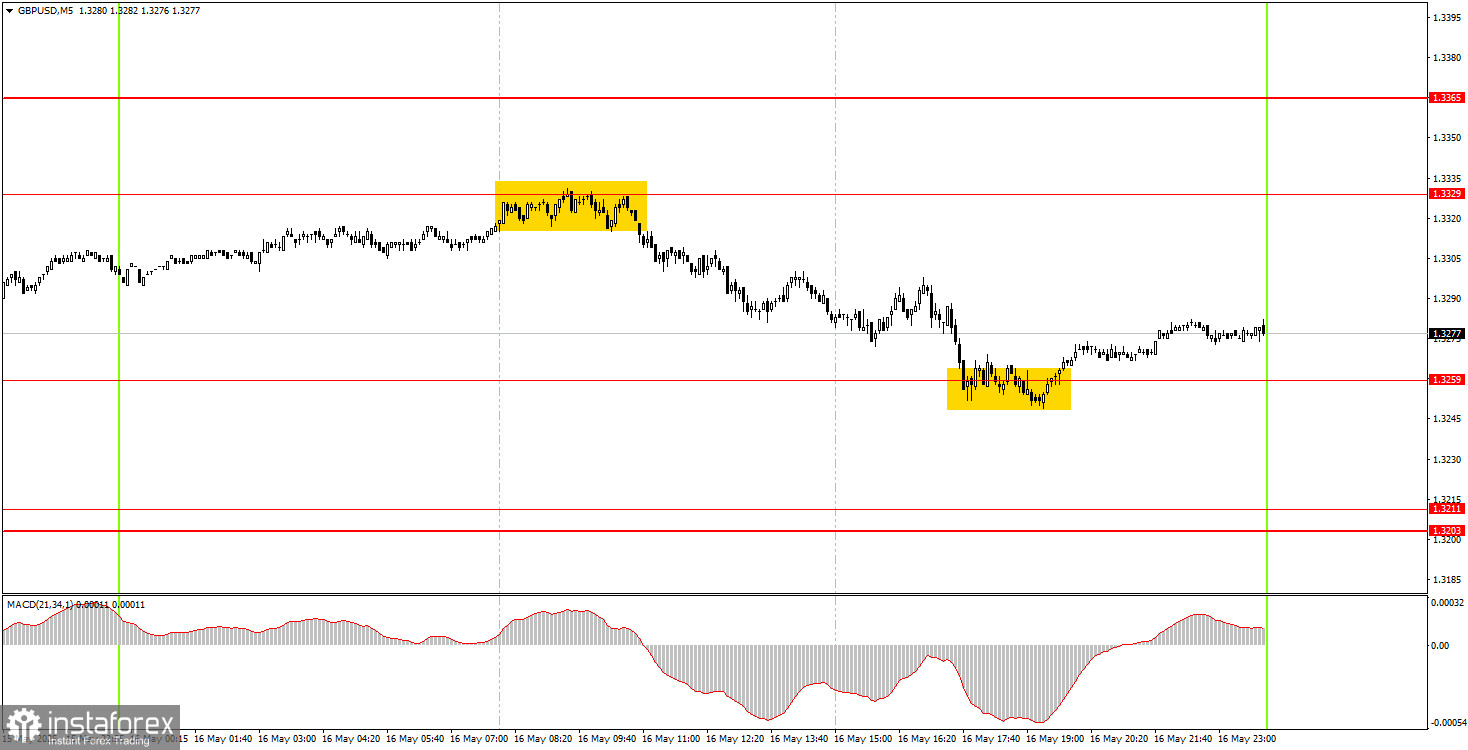
On Friday, the pair moved very technically on the 5-minute timeframe. Early in the European trading session, the price bounced off the 1.3329 level and then gradually dropped to the nearest target level, at 1.3259. Thus, novice traders could have opened short positions, which closed with a profit of around 50 pips.
In the hourly chart, the GBP/USD pair continues to be influenced only by Donald Trump, and it still reflects a skeptical attitude toward his policies. Recall that even signing a trade deal between the U.S. and the U.K. is a positive factor for the dollar, not the pound, as it was the dollar that previously fell on any news about tariffs and sanctions. Now, the dollar should logically strengthen on any news of trade de-escalation. Nevertheless, we still observe that the market remains unconvinced by the U.S. dollar.
On Monday, the GBP/USD pair will again be driven mostly by technical factors. There's little doubt the market will again look for any opportunity to sell the dollar or wait for fresh news. The market situation remains unchanged day by day.
On the 5-minute timeframe, current levels for trading are: 1.2848–1.2860, 1.2913, 1.2980–1.2993, 1.3043, 1.3102–1.3107, 1.3203–1.3211, 1.3259, 1.3329, 1.3365, 1.3421–1.3440, 1.3488, 1.3537, 1.3580–1.3598. No significant events are scheduled in the U.K. or the U.S. on Monday, so we will likely see another range-bound trading day. Of course, Donald Trump could always take center stage, or news of a trade deal with some country could emerge—but predicting this in advance is impossible.
Support and Resistance Levels: These are target levels for opening or closing positions and can also serve as points for placing Take Profit orders.
Red Lines: Channels or trendlines indicating the current trend and the preferred direction for trading.
MACD Indicator (14,22,3): A histogram and signal line used as a supplementary source of trading signals.
Important Events and Reports: Found in the economic calendar, these can heavily influence price movements. Exercise caution or exit the market during their release to avoid sharp reversals.
Forex trading beginners should remember that not every trade will be profitable. Developing a clear strategy and practicing proper money management are essential for long-term trading success.
¡Los informes analíticos de InstaForex lo mantendrá bien informado de las tendencias del mercado! Al ser un cliente de InstaForex, se le proporciona una gran cantidad de servicios gratuitos para una operación eficiente.


