 Permanecer

Condiciones de negociación
Products
Herramientas


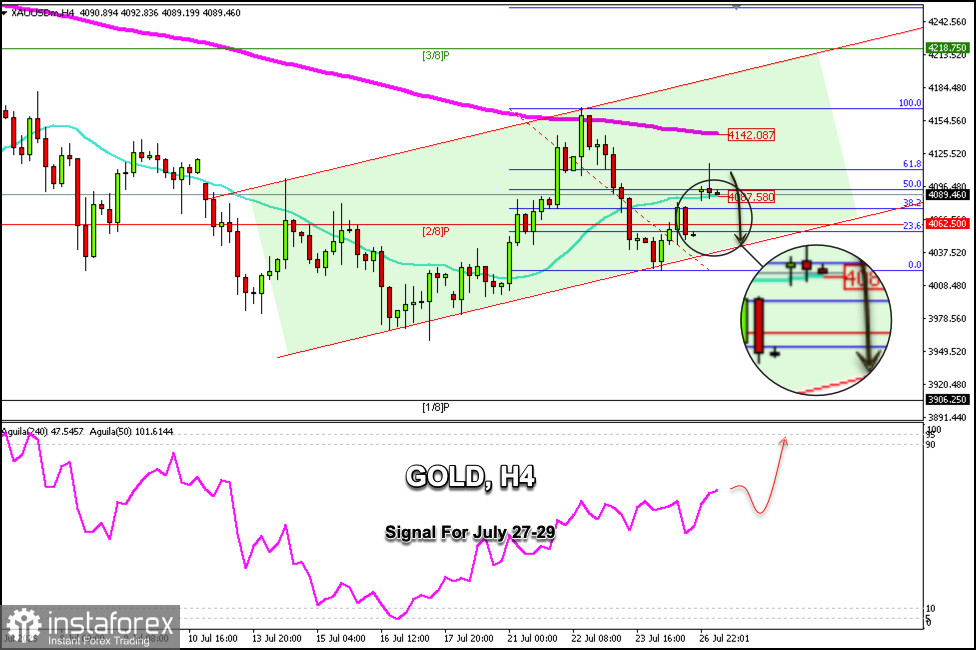
Gold is trading around $4,089 after reaching the 61.8% Fibonacci level around $4,117 and is now pulling back. On the H4 chart, we can see that gold left a gap around the $4,052 level, which is below the Murray 2/8 level. This suggests that gold is likely to continue falling in the coming days.
If, in the coming hours, gold falls below $4,087—where the 21 SMA is located—this could be interpreted as a bearish sell signal, with targets at the 2/8 Murray level, around $4,062. Ultimately, we expect it to close the gap and reach the lower band of the uptrend channel, around $4,040.
Since the trend for gold remains bullish, as indicated by the Eagle indicator, we could look for buying opportunities if the price consolidates above $4,080. Alternatively, a bounce around the 2/8 Murray level could be considered an opportunity to open long positions, with targets at the 200 EMA level, around $4,142.
If the downtrend continues and the price consolidates below the 61.8% Fibonacci level, we could expect it to reach the psychological level of $4,000 in the coming days and eventually reach the Murray 1/8 level, around $3,906.
¡Los informes analíticos de InstaForex lo mantendrá bien informado de las tendencias del mercado! Al ser un cliente de InstaForex, se le proporciona una gran cantidad de servicios gratuitos para una operación eficiente.


