 Permanecer
Condiciones de negociación
Products
Herramientas


The GBP/USD pair didn't even attempt a correction on Thursday. While the euro faced bearish pressure from weak business activity indices in the Eurozone and Germany, the British pound had no such downward drivers. Yes, the UK Manufacturing PMI also came in weak—similar to Europe—but the Services sector helped support the pound. That said, the pound currently doesn't seem to need saving.
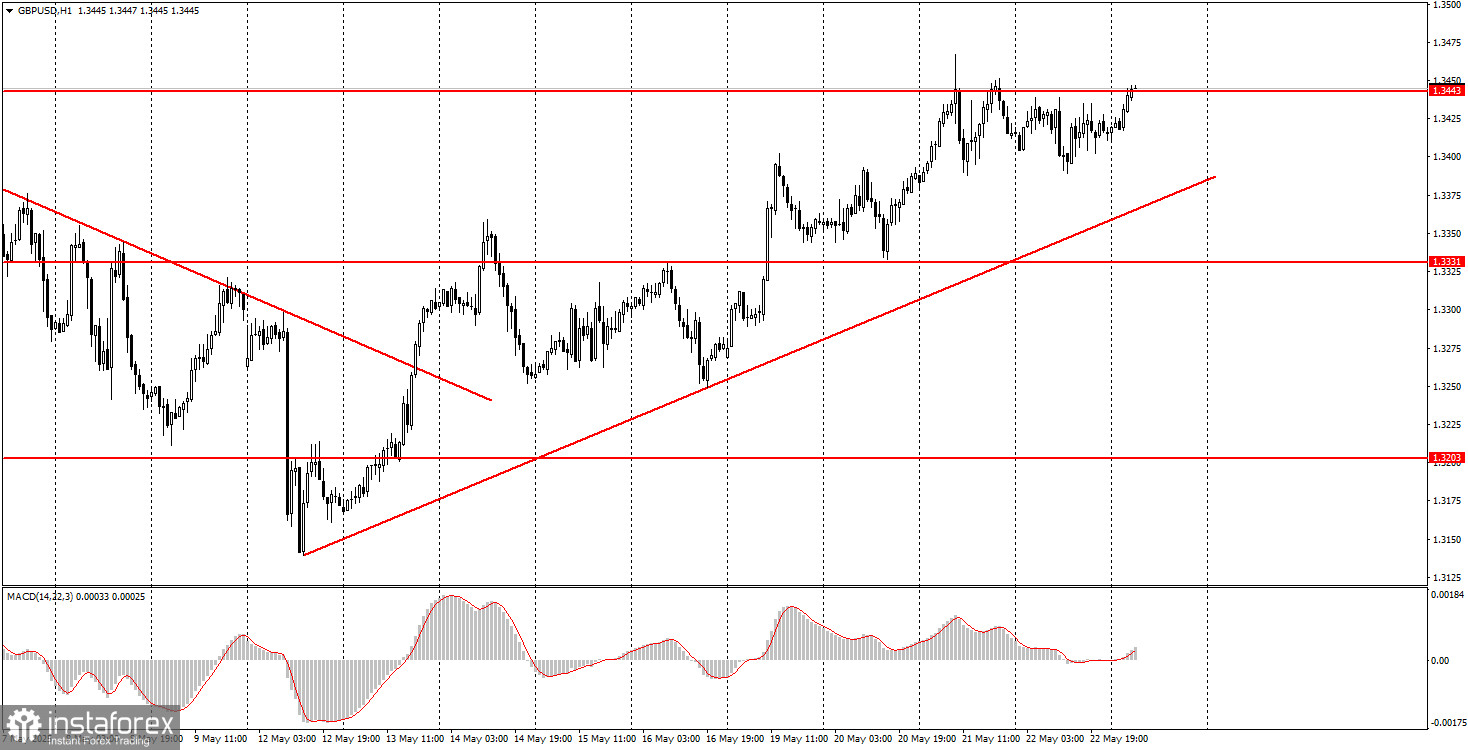
The British currency is rising Bitcoin-style — steadily and almost without corrections. Currently, the price is hovering around 1.3443, close to the upper boundary of the sideways channel the pair has been trading in for a month. We believe this level will be broken, and the pound's rally will continue. The ascending trendline confirms the current direction.
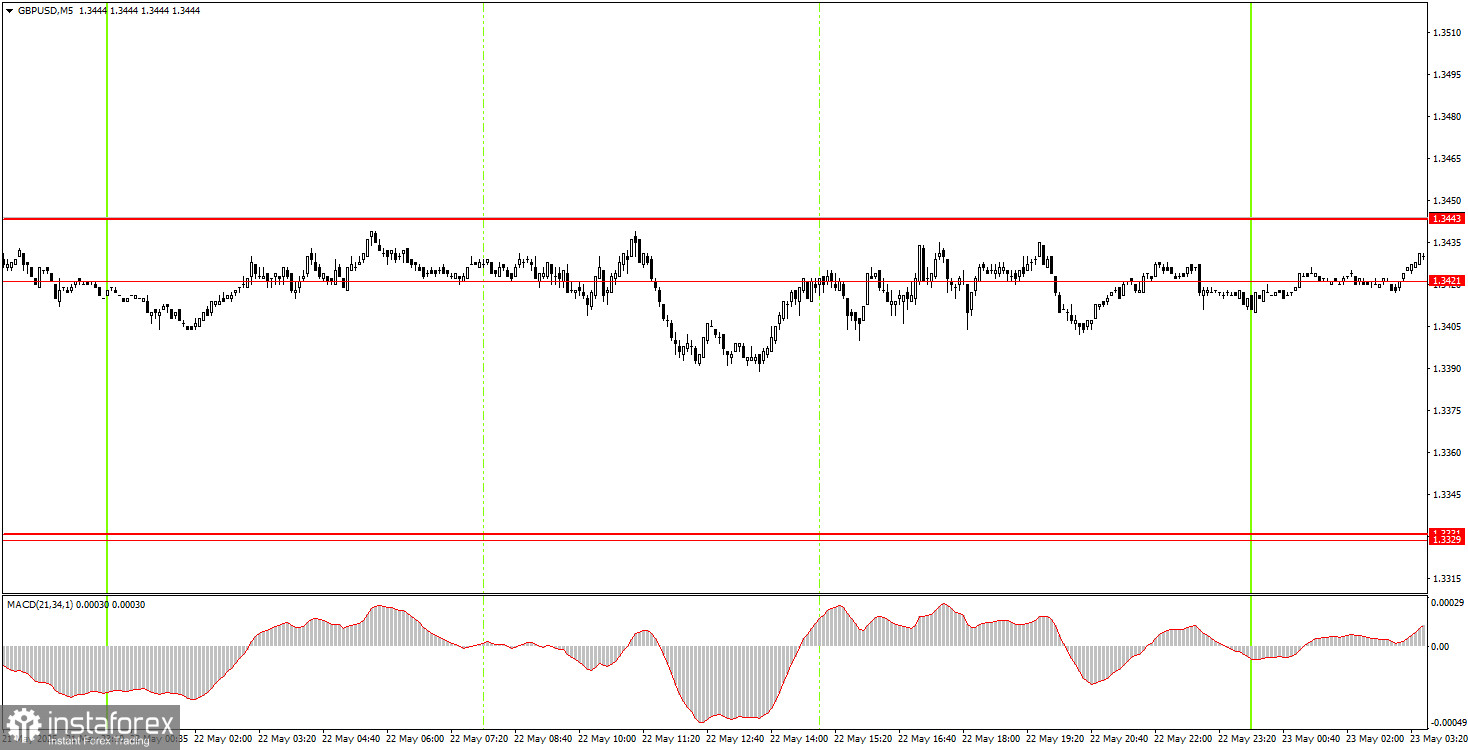
Several signals were formed in the 5-minute timeframe on Thursday, but none of them were particularly strong. The problem was that the price moved sideways all day. Traders lacked the momentum to break through the 1.3421–1.3443 zone, especially given mediocre UK data and decent U.S. figures. Moreover, there were no solid reasons to sell the pair. As a result, the price repeatedly bounced off this zone but never showed any meaningful decline.
In the hourly timeframe, GBP/USD closely follows Donald Trump's actions, maintaining a skeptical stance toward his policies. Remember that a U.S.-UK trade agreement and tariff reductions between the U.S. and China are positive for the dollar, not the pound. A Bank of England rate cut and the Federal Reserve holding rates are also positive for the dollar. Yet, we observe the opposite market reaction and price movement — the market ignores 90% of dollar-positive factors.
On Friday, the pair will likely continue trading on technical factors. The market will either look for any reason to sell the dollar or simply wait for fresh news. Market sentiment remains unchanged day after day.
On the 5-minute TF, it is now possible to trade at 1.2848-1.2860, 1.2913, 1.2980-1.2993, 1.3043, 1.3102-1.3107, 1.3203-1.3211, 1.3259, 1.3329-1.3331, 1.3421-1.3443, 1.3537, 1.3580-1.3598. The UK is scheduled to release retail sales data on Friday, but it will unlikely impact traders' prevailing "always buy" sentiment. The U.S. news calendar for May 23 is empty.
Support and Resistance Levels: These are target levels for opening or closing positions and can also serve as points for placing Take Profit orders.
Red Lines: Channels or trendlines indicating the current trend and the preferred direction for trading.
MACD Indicator (14,22,3): A histogram and signal line used as a supplementary source of trading signals.
Important Events and Reports: Found in the economic calendar, these can heavily influence price movements. Exercise caution or exit the market during their release to avoid sharp reversals.
Forex trading beginners should remember that not every trade will be profitable. Developing a clear strategy and practicing proper money management are essential for long-term trading success.
¡Los informes analíticos de InstaForex lo mantendrá bien informado de las tendencias del mercado! Al ser un cliente de InstaForex, se le proporciona una gran cantidad de servicios gratuitos para una operación eficiente.


