 Permanecer
Condiciones de negociación
Products
Herramientas


Bitcoin quickly rebounded to the $109,000 mark today. This rapid surge, especially following yesterday's dip to around $106,600, once again highlights the strong interest from large players who take advantage of market pullbacks to accumulate positions.

The observed recovery not only demonstrates Bitcoin's resilience to short-term shocks but also indicates the presence of significant capital ready to support the asset at the first signs of correction. Whales are likely viewing such dips as strategic buying opportunities, which in turn reinforces Bitcoin's position in the market.
Glassnode data supports this view: the total open interest in BTC futures across major exchanges has surged to a record $46.2 billion. This unprecedented level of activity in the derivatives market reflects Bitcoin's growing institutionalization and deeper integration into the traditional financial system.
The increase in open interest may be driven by both new participants entering the market and existing players expanding their positions, either to profit from crypto volatility or to hedge their risks. This institutional momentum has played a key role in supporting the current performance of the market.
However, record-high open interest brings both opportunities and risks. On one hand, it indicates market maturity and improved liquidity, which facilitates large transactions and reduces transaction costs.
On the other hand, a high concentration of open positions may create the conditions for sharp price swings and so-called "liquidation cascades," where mass stop-loss triggers lead to further price drops. That's why market participants — especially smaller traders — need to remain cautious and analyze the situation carefully.
Still, as noted above, the current trend suggests continued optimism among major holders, which is undeniably a positive signal for the entire crypto community. The key question now is how long this bullish trend will last and what factors might influence its future trajectory.
Trading recommendations
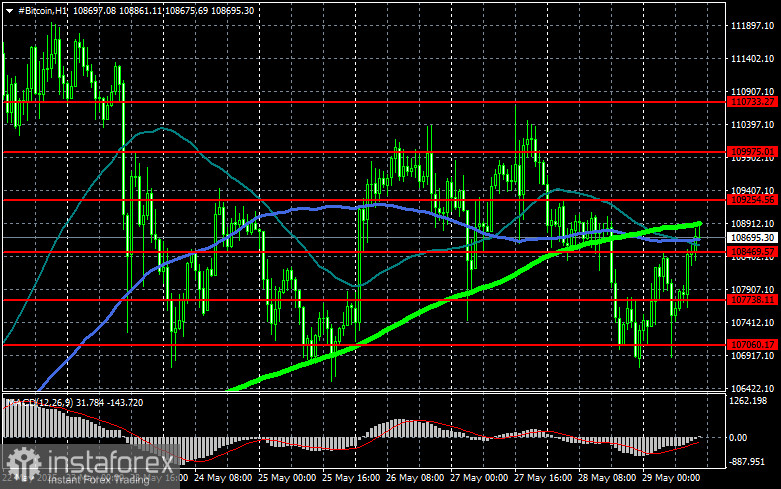
Bitcoin (BTC): From a technical standpoint, buyers are currently targeting a return to the $108,400 level, which would open the path toward $109,900, and from there, it's a short leap to $110,700. The furthest bullish target sits at the $111,400 area. A breakout above it would signal a strong continuation of the bull market.
If Bitcoin falls, buyers are expected to step in at the $107,000 level. A move back below this zone could send BTC quickly toward $106,200. The furthest bearish target is around $105,200.
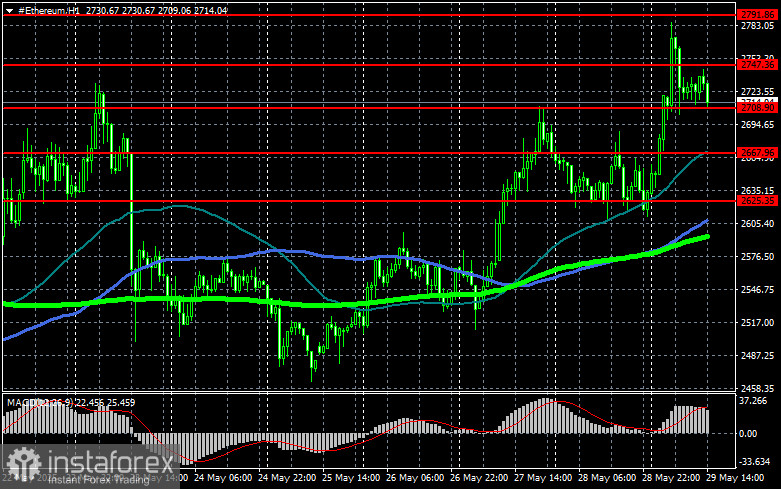
Ethereum (ETH): A confirmed hold above the $2,747 level opens the direct path to $2,791. The most distant bullish target lies around $2,838 — a breakout above which would also confirm a strong bull market structure.
If ETH declines, buyers are expected at the $2,708 zone. A drop below this area could push ETH down to $2,667, with the furthest bearish target near $2,625.
What's on the chart
Price testing or crossing any of these moving averages often either halts movement or injects fresh momentum into the market.
¡Los informes analíticos de InstaForex lo mantendrá bien informado de las tendencias del mercado! Al ser un cliente de InstaForex, se le proporciona una gran cantidad de servicios gratuitos para una operación eficiente.


