 Permanecer
Condiciones de negociación
Products
Herramientas



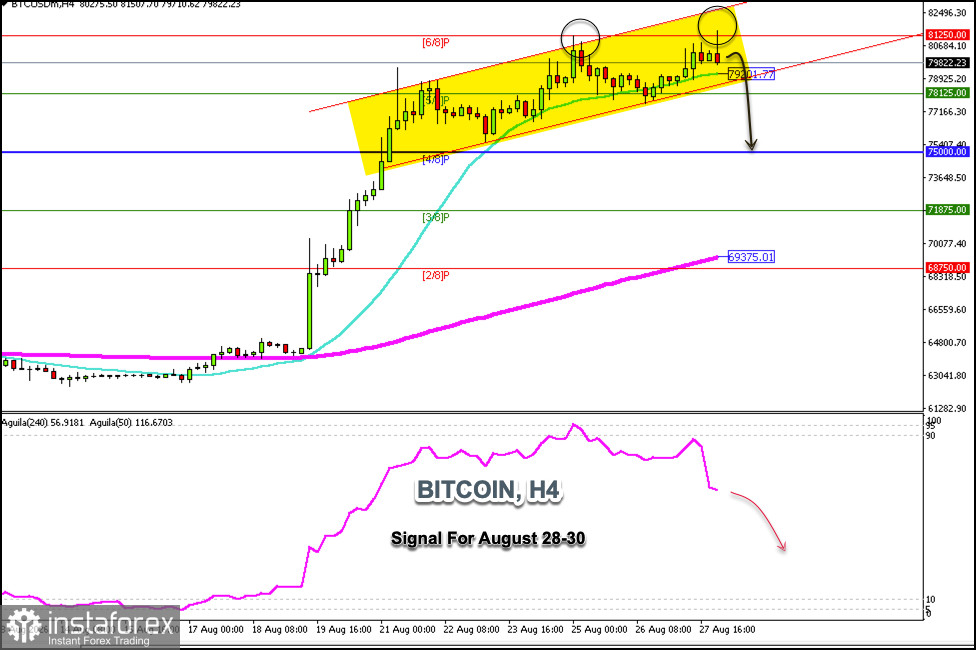
Bitcoin is trading around $79,822, pulling back after hitting the strong Murray 6/8 resistance level, and we can also see on the H4 chart that BTC has formed a double-top pattern.
This double-top pattern could signal a downtrend for Bitcoin, but for this to occur, we would need confirmation if BTC trades below $78,125, where the 5/8 Murray level is located.
If there is a drop below the 21 SMA, Bitcoin could continue to fall in the coming days, with a pullback to the 61.8% Fibonacci level likely, and it could eventually reach $75,000; ultimately, we expect it to reach the psychological level of $70,000.
Conversely, as long as Bitcoin stages a technical rebound above $79,000—around the lower band of the uptrend channel—this could be seen as a buy signal in the coming days, with the expectation that it will reach $81,250 and could even hit the upper band of the uptrend channel, which is around $82,900.
Bitcoin is currently overbought, and the Eagle indicator is showing a negative signal. Therefore, if BTC makes another attempt to break through the 6/8 Murray level and fails to overcome this zone, we could view this level as an opportunity to sell Bitcoin, with short-term targets at $70,000.
¡Los informes analíticos de InstaForex lo mantendrá bien informado de las tendencias del mercado! Al ser un cliente de InstaForex, se le proporciona una gran cantidad de servicios gratuitos para una operación eficiente.


