 Permanecer
Condiciones de negociación
Products
Herramientas


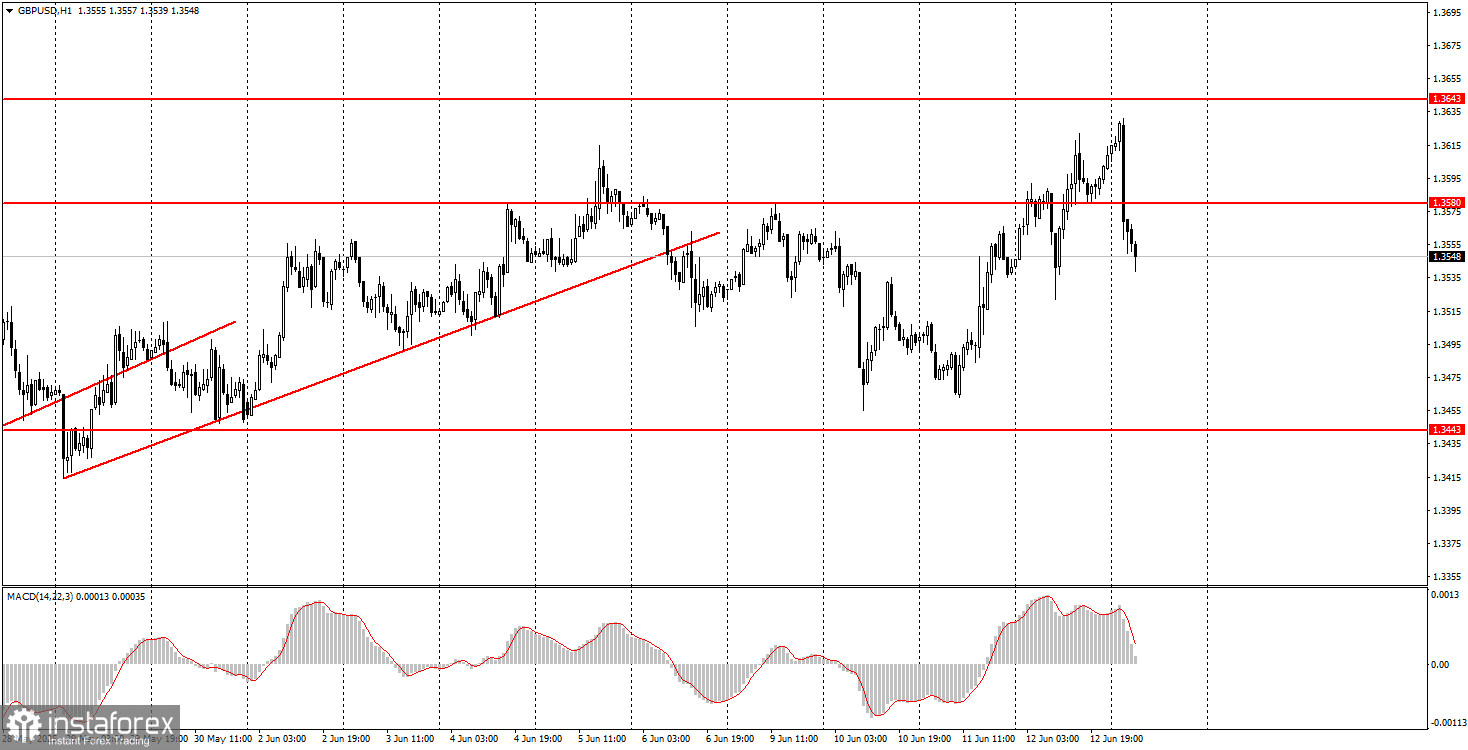
On Thursday, the GBP/USD pair demonstrated a relatively strong upward movement, though the British pound did experience intraday declines. There were many news developments. For example, during the European session, the pound came under pressure from April reports on GDP and industrial production — both indicators were weaker than forecast and showed negative growth rates.
However, later reports from the U.S. indicate that Donald Trump plans to raise tariffs on all countries on his "blacklist" to encourage quicker negotiations on trade agreements. Naturally, following this news, the dollar began to fall. During the night, the dollar was hit with another surprise: a new escalation of conflict in the Middle East. Traders rushed to buy the dollar, as it is still considered a relatively safe haven currency. That said, we do not believe the dollar will rally for long — markets are currently experiencing another storm.
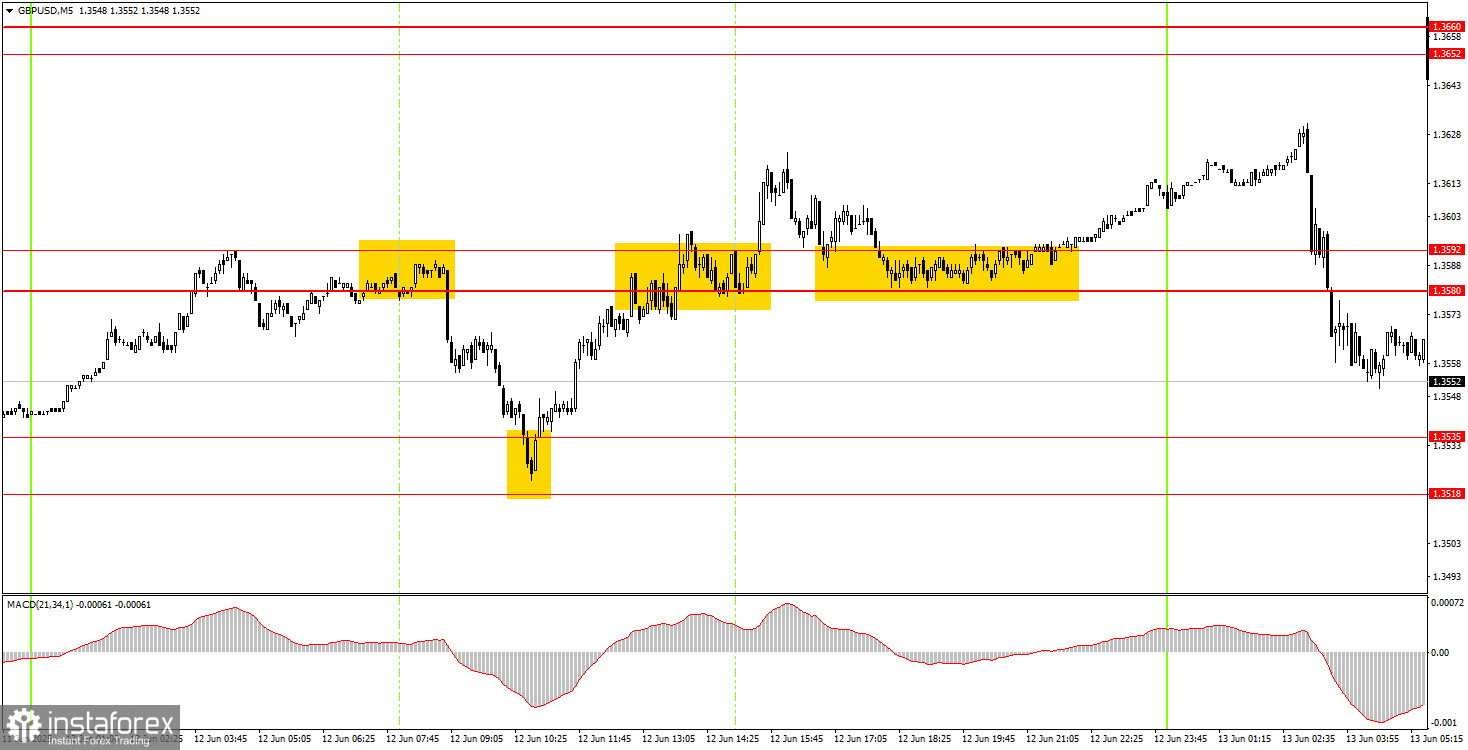
On the 5-minute timeframe Thursday, a sufficient number of trading signals were formed to generate profit. In the morning, the price rebounded from the 1.3580–1.3592 area, then declined to the 1.3518–1.3535 zone. A bounce from this area triggered a rally back above 1.3580–1.3592, and a bit later, the price bounced again from that zone. Thus, novice traders had the opportunity to open two trades — both of which were profitable.
In the hourly chart, the GBP/USD pair continues to respond primarily to Trump and remains highly skeptical of his policies. As before, the market uses every opportunity to sell the dollar rather than buy it. This will continue until the market sees clear signs of an end to the trade war and Trump stops making unauthorized decisions. The escalation of the military conflict between Israel and Iran helped the dollar somewhat, but we do not believe this factor outweighs the others that have been pressuring the dollar for the past four months.
On Friday, the GBP/USD pair may experience significant volatility, depending on news from Trump regarding either the trade war or the conflict between Iran and Israel.
On the 5-minute TF, it is now possible to trade at 1.3043, 1.3102-1.3107, 1.3203-1.3211, 1.3259, 1.3329-1.3331, 1.3421-1.3443, 1.3518, 1.3580-1.3592, 1.3652-1.3660, 1.3695, 1.3740. No significant events are scheduled in the UK for Friday, and in the U.S., only the University of Michigan Consumer Sentiment Index is on the agenda. However, geopolitical and trade-related news (if any) will be the top priority for the markets today.
Support and Resistance Levels: These are target levels for opening or closing positions and can also serve as points for placing Take Profit orders.
Red Lines: Channels or trendlines indicating the current trend and the preferred direction for trading.
MACD Indicator (14,22,3): A histogram and signal line used as a supplementary source of trading signals.
Important Events and Reports: Found in the economic calendar, these can heavily influence price movements. Exercise caution or exit the market during their release to avoid sharp reversals.
Forex trading beginners should remember that not every trade will be profitable. Developing a clear strategy and practicing proper money management are essential for long-term trading success.
¡Los informes analíticos de InstaForex lo mantendrá bien informado de las tendencias del mercado! Al ser un cliente de InstaForex, se le proporciona una gran cantidad de servicios gratuitos para una operación eficiente.


