 Permanecer
Condiciones de negociación
Products
Herramientas


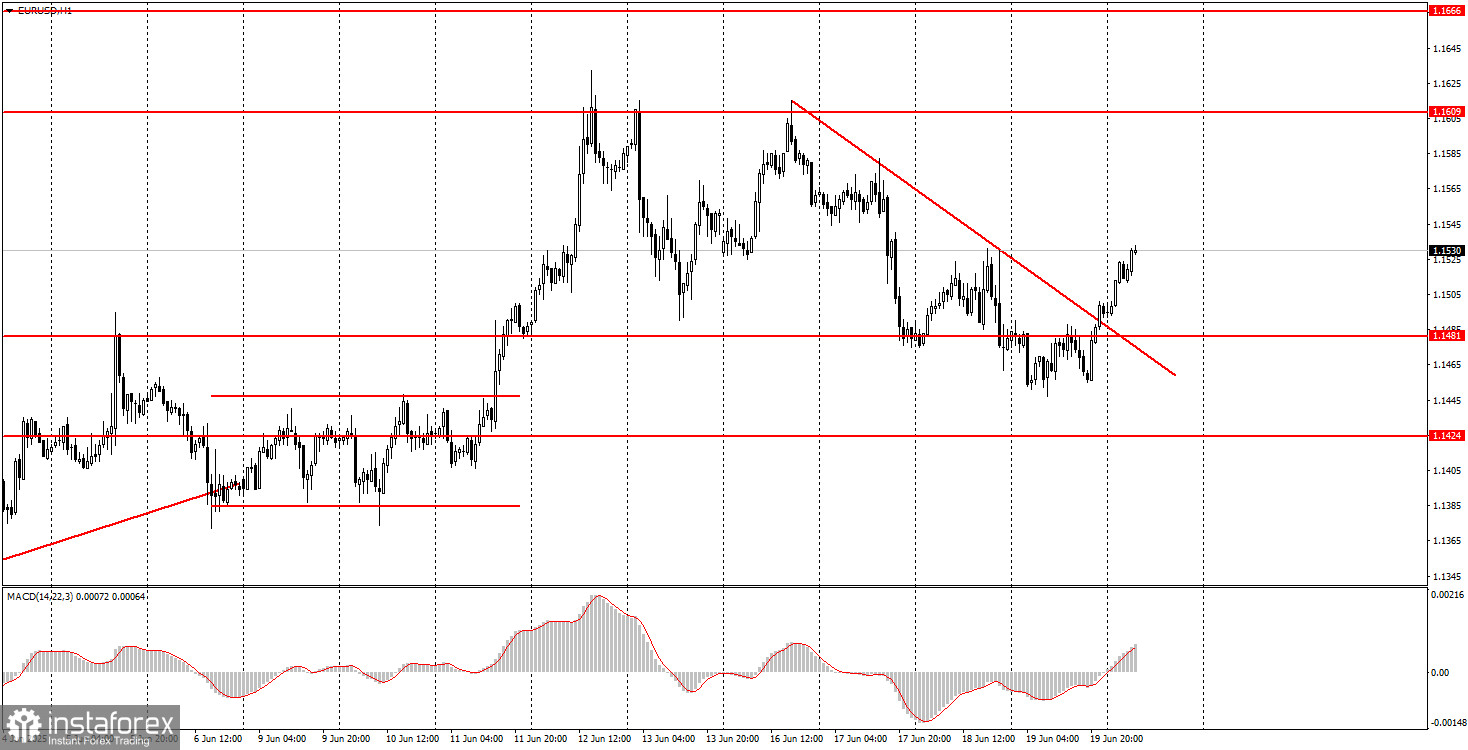
On Thursday, the EUR/USD currency pair attempted to extend its decline within the new downward trend, but the dollar's rally ended. We had warned earlier that one shouldn't expect a strong appreciation of the U.S. currency under current conditions. One could say the dollar has already squeezed the most it could out of this week. It appreciated on news that Donald Trump might launch a devastating strike on Iran and the "moderately hawkish" results of the Federal Reserve meeting. Soon after, the market remembered that the trade war and Trump's controversial, protectionist decisions aimed at reshaping the global order remain the top concerns. As early as Thursday evening, the dollar resumed its decline, which continued overnight, even without any clear catalyst. The descending trendline has been broken, and the bearish trend ended before it could truly begin.
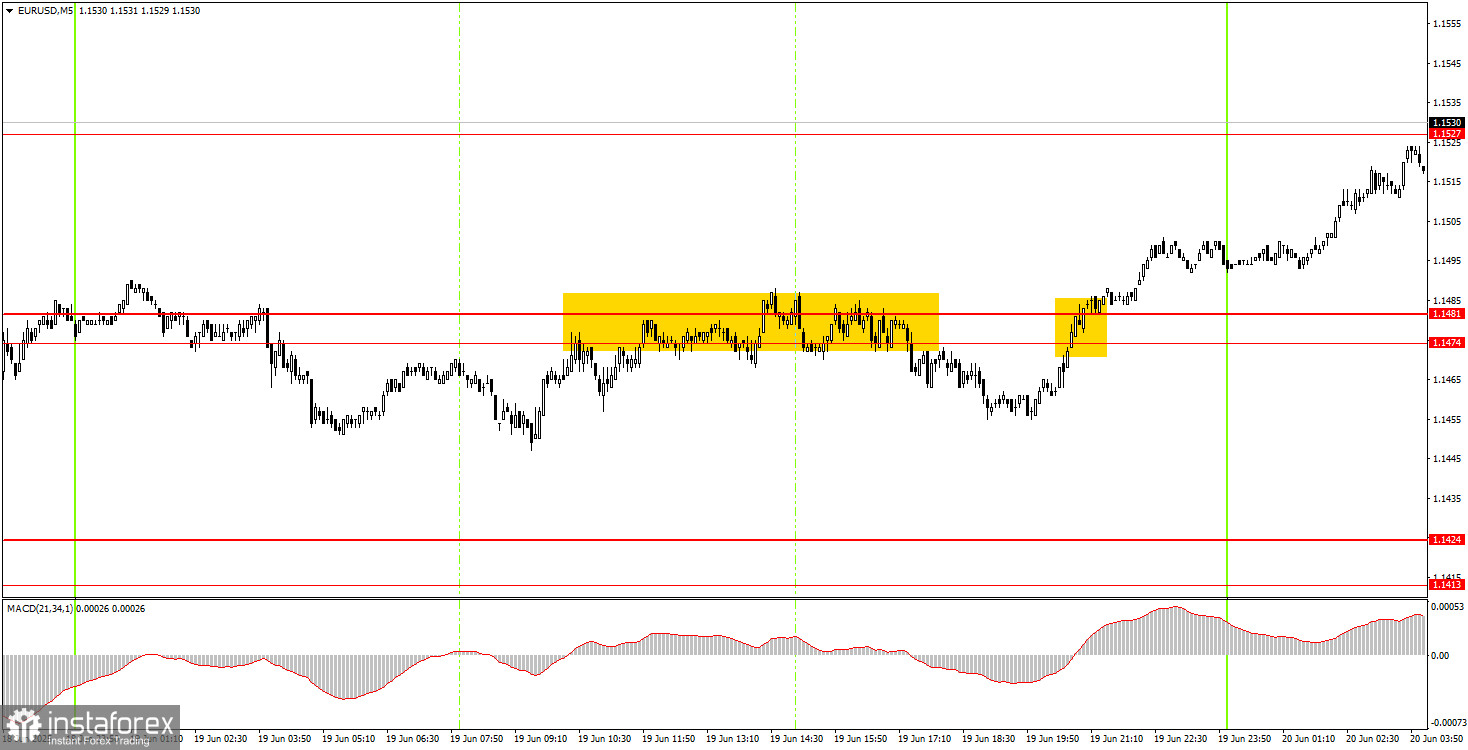
On the 5-minute time frame Thursday, two formal trading signals were generated. During the 5–6 AM hours, the pair formed a sell signal around the 1.1474–1.1481 area, but it failed to move more than 15 pips — and even those were reached with difficulty. Later, a buy signal emerged near the same area, which could have yielded a solid profit, as that's precisely when the dollar began another leg down. However, this signal formed relatively late in the session, and not all traders may have been able to act on it.
In the hourly time frame, the EUR/USD pair continues its uptrend, which began under Trump and may only end under the next president. In fact, the mere fact that Trump is president seems sufficient for the U.S. dollar to keep depreciating regularly. Even the escalation between Iran and Israel hasn't significantly altered the broader position of the dollar. The U.S. leader continues to threaten, issue ultimatums, raise tariffs, and even appears ready to go to war with Iran. Therefore, while the market may not sell the dollar daily, it has no intention of buying it from a medium-term perspective either.
On Friday, the EUR/USD pair may continue rising, given the break of the descending trendline and the fact that all dollar-supportive factors have now been priced in.
On the 5-minute TF, the following levels should be considered: 1.1132-1.1140, 1.1198-1.1218, 1.1267-1.1292, 1.1354-1.1363, 1.1413-1.1424, 1.1474-1.1481, 1.1527, 1.1561-1.1571, 1.1609, 1.1666, 1.1704, 1.1802. On Friday, there will be no major macroeconomic or fundamental releases in the Eurozone or the U.S., so volatility may again be quite weak throughout the day. The next significant upward movement in the pair may be postponed until next week.
Support and Resistance Levels: These are target levels for opening or closing positions and can also serve as points for placing Take Profit orders.
Red Lines: Channels or trendlines indicating the current trend and the preferred direction for trading.
MACD Indicator (14,22,3): A histogram and signal line used as a supplementary source of trading signals.
Important Events and Reports: Found in the economic calendar, these can heavily influence price movements. Exercise caution or exit the market during their release to avoid sharp reversals.
Forex trading beginners should remember that not every trade will be profitable. Developing a clear strategy and practicing proper money management are essential for long-term trading success.
¡Los informes analíticos de InstaForex lo mantendrá bien informado de las tendencias del mercado! Al ser un cliente de InstaForex, se le proporciona una gran cantidad de servicios gratuitos para una operación eficiente.


