 Permanecer
Condiciones de negociación
Products
Herramientas


On Friday, the EUR/USD currency pair finished its downward movement. As we expected, the dollar's strengthening was very short-lived. The market still sees no reason to buy the US currency even in the medium term. Traders react to isolated dollar-positive events, and sometimes the price has to correct. But all these corrections remain extremely weak. The situation has remained unchanged for the past five months: either the euro rises or stays flat. On Friday, there were no macroeconomic, fundamental, or news drivers. The only notable development was that Donald Trump reversed his decision to act on Iran within 48 hours (which had long since expired). The US president stated he would take two weeks to decide, and most experts immediately concluded that Trump does not want to get involved in a Middle Eastern war while still trying to appear as a peacemaker. As a result, we heard a series of empty threats directed at Iran that are unlikely to materialize. This likely caused the dollar to weaken, as the prospects of new conflict escalation were neutralized for the next two weeks.
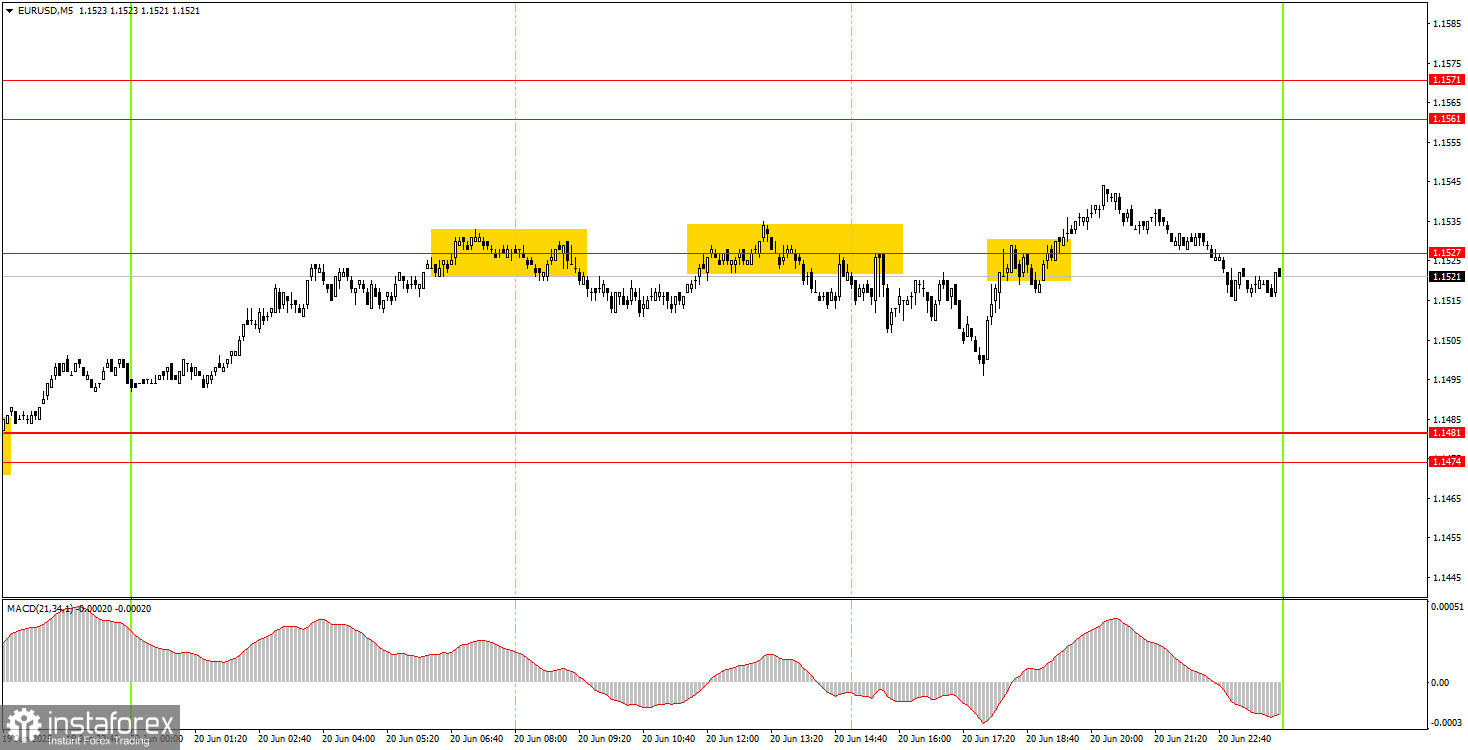
In the 5-minute time frame, the pair formed three trading signals on Friday but spent the entire day in a sideways range. The price rebounded twice from the 1.1527 level and broke through it once. In all three cases, the pair moved no more than 25 pips in the intended direction. The total daily volatility amounted to 52 pips.
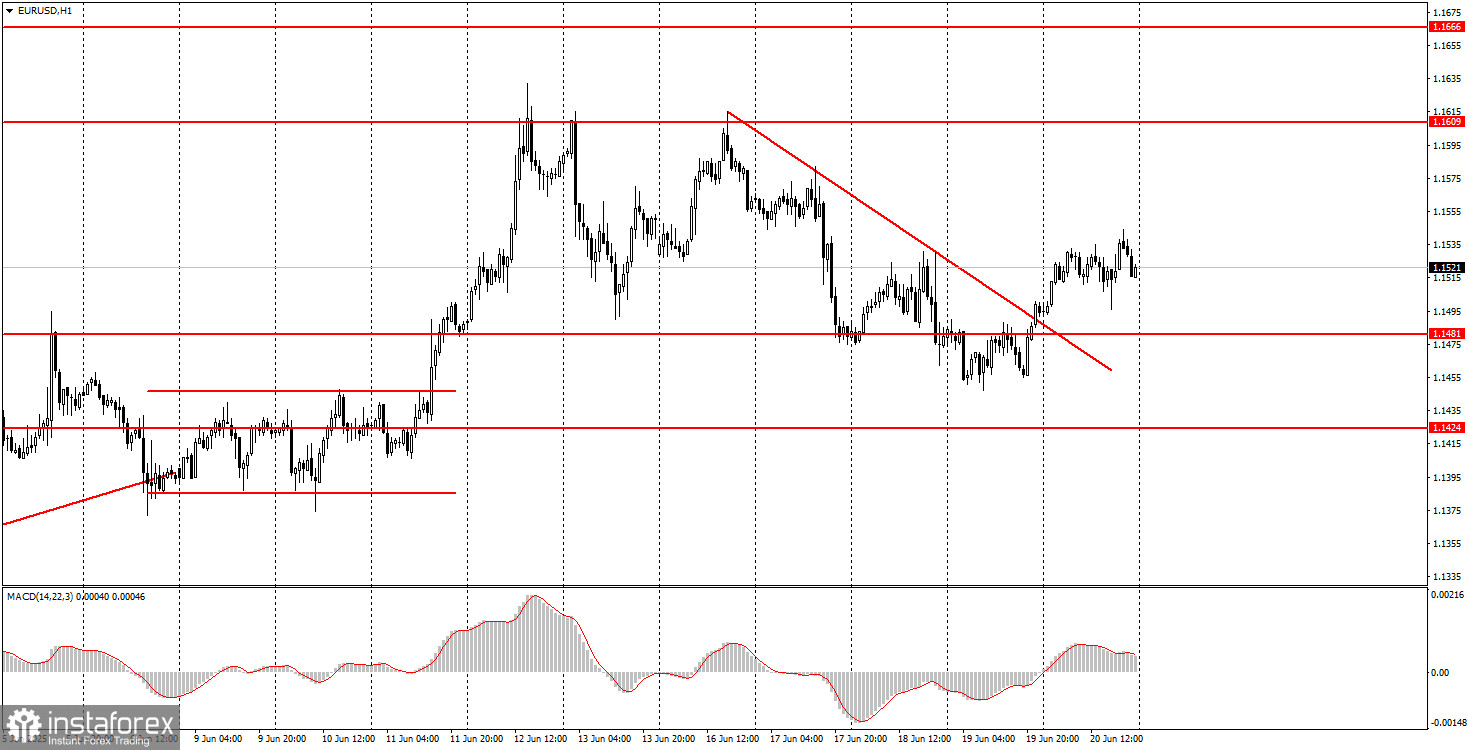
In the hourly time frame, the EUR/USD pair continues the upward trend that began during Trump's presidency and will most likely end under the next president. The fact that Trump is still the president of the United States is enough for the dollar to depreciate regularly. Even the escalation of the conflict between Iran and Israel has not significantly affected the overall position of the US currency. The US leader continues to issue threats, make ultimatums, and impose or raise tariffs. Therefore, even if it's not selling the dollar every day, the market is certainly not considering buying it in the medium term.
On Monday, the EUR/USD pair may continue to rise since the descending trendline has been broken and the dollar has already priced in all its favorable factors.
On the 5-minute time frame, the relevant levels to watch are 1.1132–1.1140, 1.1198–1.1218, 1.1267–1.1292, 1.1354–1.1363, 1.1413–1.1424, 1.1474–1.1481, 1.1527, 1.1561–1.1571, 1.1609, 1.1666, 1.1704, 1.1802. On Monday, June's service and manufacturing PMI indices will be published in Germany, the Eurozone, and the United States. While these data may not be crucial, they could still trigger a slight market response.
Support and Resistance Levels: These are target levels for opening or closing positions and can also serve as points for placing Take Profit orders.
Red Lines: Channels or trendlines indicating the current trend and the preferred direction for trading.
MACD Indicator (14,22,3): A histogram and signal line used as a supplementary source of trading signals.
Important Events and Reports: Found in the economic calendar, these can heavily influence price movements. Exercise caution or exit the market during their release to avoid sharp reversals.
Forex trading beginners should remember that not every trade will be profitable. Developing a clear strategy and practicing proper money management are essential for long-term trading success.
¡Los informes analíticos de InstaForex lo mantendrá bien informado de las tendencias del mercado! Al ser un cliente de InstaForex, se le proporciona una gran cantidad de servicios gratuitos para una operación eficiente.


