 Permanecer
Condiciones de negociación
Products
Herramientas


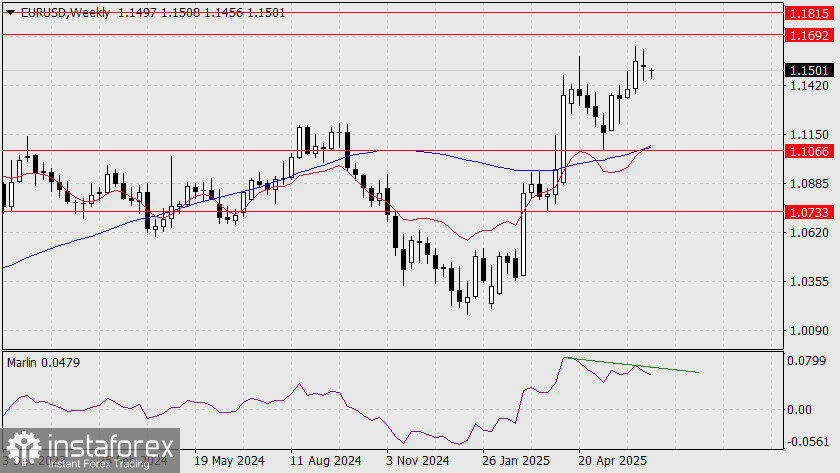
A bearish divergence has formed on the weekly chart for the euro. We are preparing for a reversal into a long-term downward trend, but divergences with a gap often unfold in a complex manner. Thus, the price may still work through the target level at 1.1692, with the divergence evolving in form. A similar scenario occurred in November–December 2020.
Additionally, we are keeping a close eye on the stock market, as we believe the anticipated reversal will likely coincide with a market correction. On the daily chart, Monday opened below the MACD line. If the day ends with a black candlestick, we may see consolidation in the 1.1420–1.1535 range for a few days before the gap is closed.
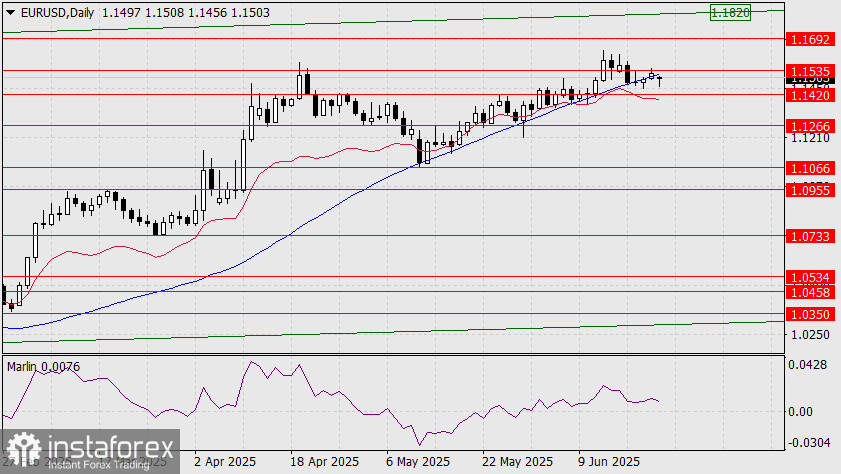
Closing the gap would imply a breakout above the MACD line and possibly beyond 1.1535, opening the path toward the target level at 1.1692 (October 2021 high). There are also prominent levels above this area from 2021, which the price may attempt to reach. However, that would invalidate the weekly divergence.
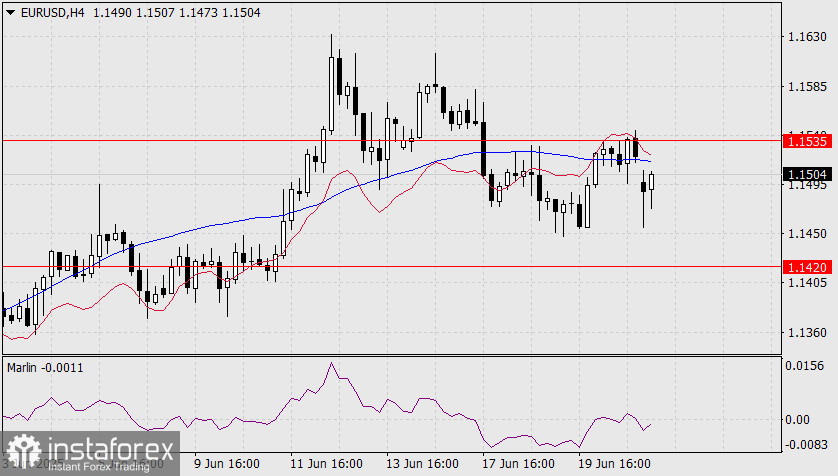
In the H4 timeframe, the price trades are below both indicator lines, and the Marlin oscillator is in negative territory, indicating a bearish trend. Still, the likelihood of gap closure is high, so we maintain the primary bullish scenario, albeit with the possibility of sideways movement for 1–2 days.
¡Los informes analíticos de InstaForex lo mantendrá bien informado de las tendencias del mercado! Al ser un cliente de InstaForex, se le proporciona una gran cantidad de servicios gratuitos para una operación eficiente.


