 Permanecer

Condiciones de negociación
Products
Herramientas


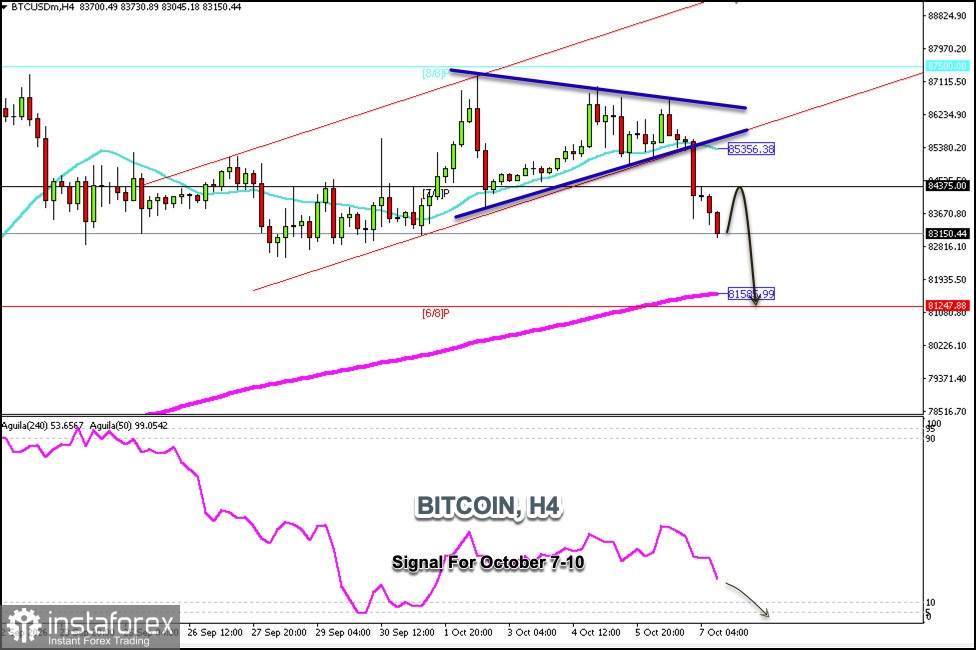
Bitcoin is trading around $83,150 with strong downside potential after breaking below the uptrend channel that had formed since September 27. At the same time, we can see the formation of a symmetrical triangle pattern on the chart, which was also broken to the downside from the 85K level, reaching the $83K level, and could even continue falling to $81, 247, around the 6/8 Murray level.
If Bitcoin rebounds above $83,000 in the coming hours—since it has been consolidating above this zone between September 23 and September 27—it could provide immediate support, and we could expect it to reach the 7/8 Murray level around $84,375; the rebound could even push it toward the 21 SMA at $85,356.
Given that Bitcoin has entered a technically bearish phase, we believe that any technical rebound toward $85,000 could be considered a signal to continue selling in the coming days.
If BTC consolidates below the 200 EMA around $81,585, we could expect it to continue falling until it reaches the 5/8 Murray level around $77,500.
Given the strong support around 81,249—which also coincides with the 6/8 Murray line and the 200 EMA—this area could be seen as a strong potential point to re-enter long positions, and we could expect the price to reach the psychological level of $90,000 if it breaks above this zone.
Given that the Eagle indicator is showing a negative signal, a rebound toward $84,375,000 or $85,353 would be seen as a signal to sell.
¡Los informes analíticos de InstaForex lo mantendrá bien informado de las tendencias del mercado! Al ser un cliente de InstaForex, se le proporciona una gran cantidad de servicios gratuitos para una operación eficiente.


